Categories
データ可視化
さまざまなチャートを作成できるツール集です。

RAWGraphs2
多様なチャートを手軽に作成

Sankeymatic
サンキー・ダイアグラムを手軽に
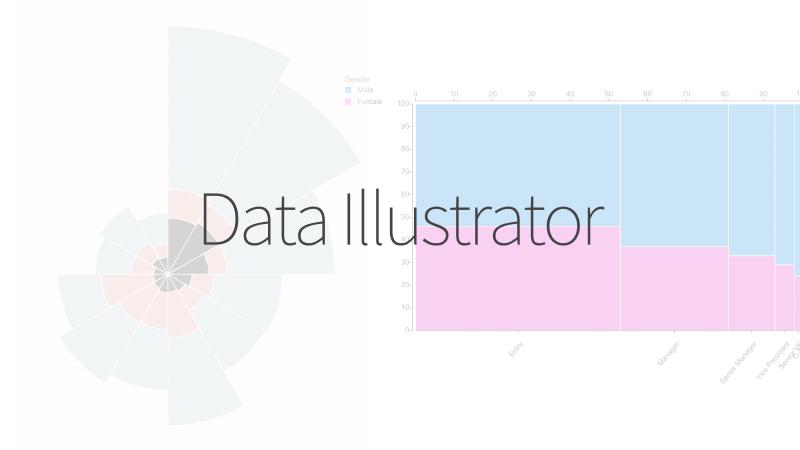
Data Illustrator
多様なチャートを手軽に作成

Gephi Lite
ネットワークグラフを手軽に作成
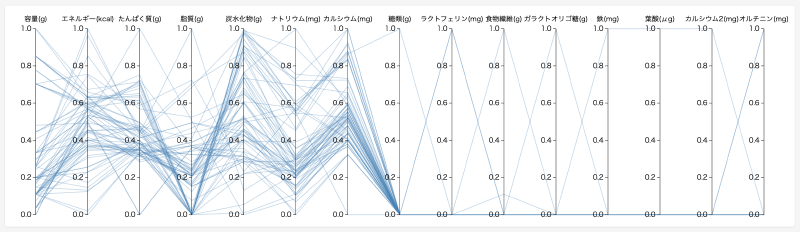
Parallel Coordinates
多次元データの比較・探索に特化したインタラクティブなチャート
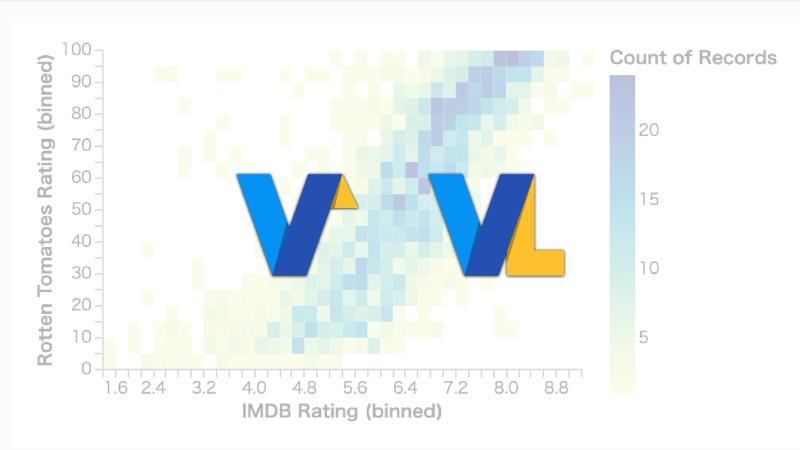
Vega Editor
JSON 形式で可視化仕様を書くことで、インタラクティブなグラフやチャートをリアルタイムにレンダリング

Word Cloud
日本語に特化したWord Cloud