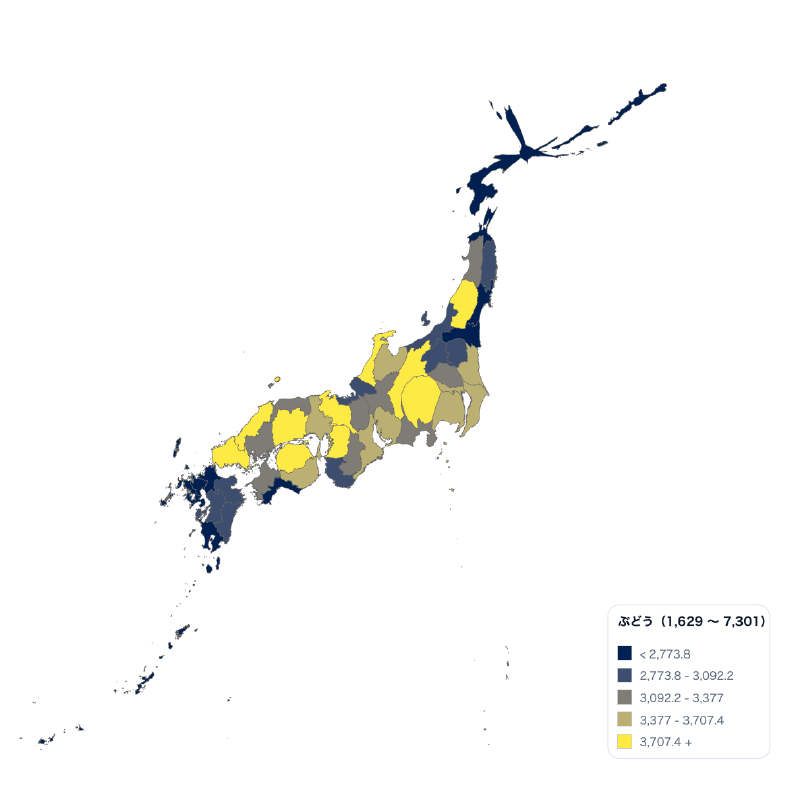
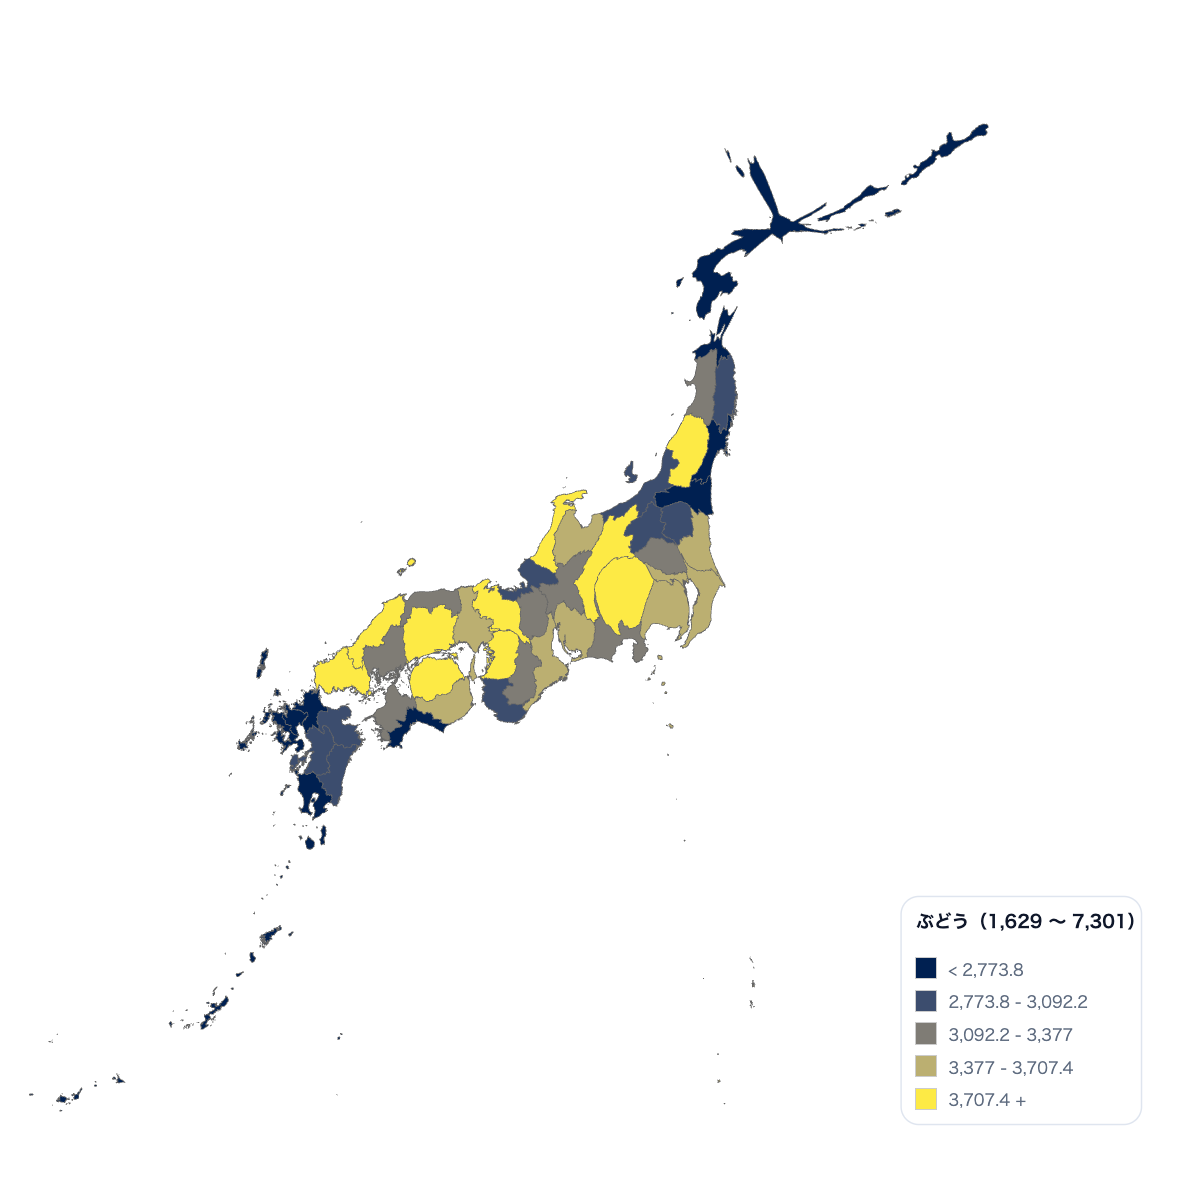
What is this tool?
A unified web tool for creating cartograms from either nationwide prefecture data or municipality data within a selected prefecture. It distorts region area and shape according to statistical values, highlighting patterns that are difficult to see on a conventional map.
Features
- Choose Japan or prefecture scope in one builder
- Distort prefecture or municipality areas according to statistical values
- Data value reflection: Map shapes change based on the data you input.
- Ranking mode: Automatically generates ranking data sorted by value in descending order. Ranking data can be used for color coding.
- Interactive display: Browse and interact with the map on the web.
- Export as PNG or SVG images
How to use
- Specify your data…Upload or enter numerical data by region in CSV format (e.g., population, GDP, vote counts).
- Generate the cartogram…Based on the specified statistical values, a distorted cartogram of the Japan map is generated and displayed on screen.
- Adjust and review…Adjust parameters (color, degree of distortion, region label display, etc.) as needed and review the results.
Data formats
- Tabular data (CSV)