← Back to Catalogue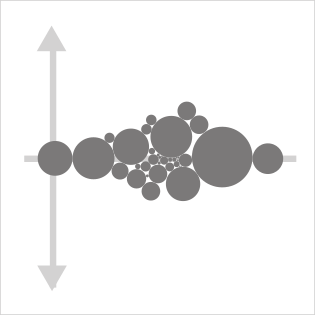
Beeswarm Plot
Beeswarm Plot
Numeric
You can create this chart with…

This chart displays the distribution of a single data variable using one dot per data point. When showing multiple variables, they can be color-coded within a single chart or arranged side by side. Instead of stacking dots along an axis, dots are drawn as an evenly spaced cluster, so even when data points are concentrated in a particular range, the degree of concentration is visible as a wider area, and individual data points remain distinguishable.