← Back to Catalogue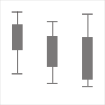
Box-And‐Whisker Plot
Box-And‐Whisker Plot
Numeric
You can create this chart with…


This chart uses a box and lines (whiskers) to display five summary statistics. The positions of the box indicate the first quartile (25th percentile), the second quartile (50th percentile), and the third quartile (75th percentile), while the endpoints of the whiskers indicate the minimum and maximum values.