← Back to Catalogue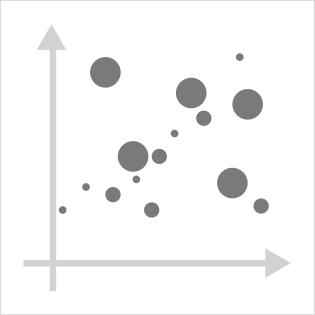
Bubble Chart
Bubble Chart
Numeric
You can create this chart with…


Similar to a scatter plot, but with two additional visual attributes – circle size and color – to which two more variables can be assigned. This makes it effective for examining correlation trends while simultaneously checking whether characteristics differ across groups. In this context, a chart that adds two visual variables to a scatter plot is referred to as a bubble chart, distinguishing it from a symbol chart that uses circles.