← Back to Catalogue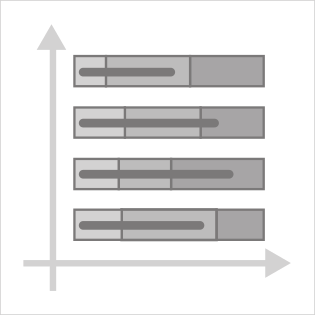
Bullet Graph
Bullet Graph
Numeric
You can create this chart with…


Displayed alongside a bar chart, this graph shows the difference from a target and qualitative evaluations (such as good, average, or poor) inside the bar. A thin rule line running in the same direction as the bar may be used to indicate specific quantities, or to mark the target value as a reference point.