← Back to Catalogue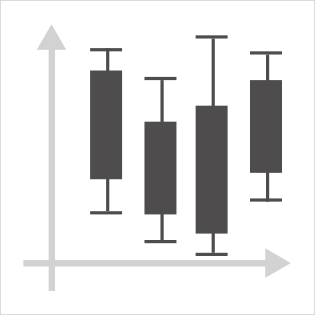
Candlestick Chart
Candlestick Chart
Time
You can create this chart with…


For each unit of time in a time series, this chart simultaneously displays data such as the maximum value, minimum value, opening value, and closing value. It is commonly used for social activities such as stock market price movements, and is also sometimes applied to natural phenomena such as temperature.