← Back to Catalogue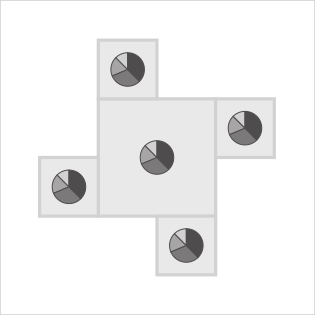
Chartmaps
Chartmaps
Location
You can create this chart with…

Statistical charts reflecting regional data are drawn on a map. In the case of pie charts, a variable can also be assigned to the overall area of each pie. This can be thought of as small multiples arranged according to geographic positions on a map.
A drawback is that in densely packed areas – such as the southern Kanto region where prefectures are clustered together – charts may not fit in their proper locations and need to be repositioned (for example, placing Tokyo’s chart over Tokyo Bay), which diminishes the effectiveness of the geographic layout.
If making charts smaller allows them to fit but compromises readability, consider using standard small multiples instead of this map-based approach.