← Back to Catalogue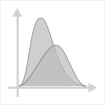
Density Plot
Density Plot
Numeric
You can create this chart with…


This chart depicts a probability distribution as a smooth curve. When kernel density estimation is used to draw the curve, it is sometimes referred to as a kernel density plot.