← Back to Catalogue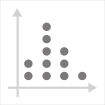
Dot Plot
Dot Plot
Numeric
Tools that can create this chart…

A frequency distribution is shown with one dot representing one data point. It uses a single variable, with axes arranged in parallel. The horizontal axis represents data values or data classes, while the vertical axis represents frequency, with the number of dots indicating the count.