← Back to Catalogue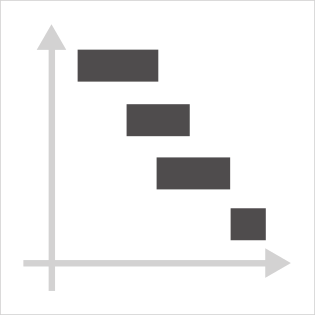
Gantt Chart
Gantt Chart
Time
Tools that can create this chart…

The horizontal axis represents time, showing the duration for each category. It is used to compare the active periods of people or services, or to show the timeline breakdown of a single project.