← Back to Catalogue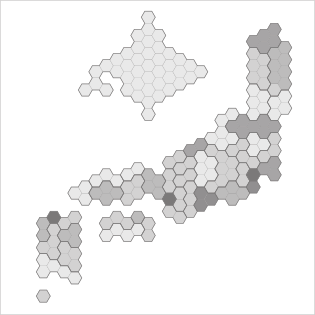
Gridded Cartogram
Gridded Cartogram
Location
Regions such as prefectures or municipalities are all represented using identical shapes such as circles, squares, or hexagons, where the number of shapes represents area and coloring represents data values.