← Back to Catalogue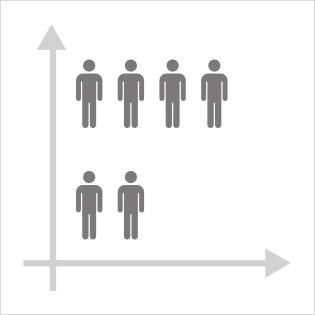
Isotype Chart
Isotype Chart
Numeric
Tools that can create this chart…

Pictograms are used to represent quantities by lining up the corresponding number of icons. By using different types of pictograms, categories can be indicated. However, it is preferable that the pictograms are relevant to the theme being addressed.