← Back to Catalogue
Line Chart
Line Chart
Time
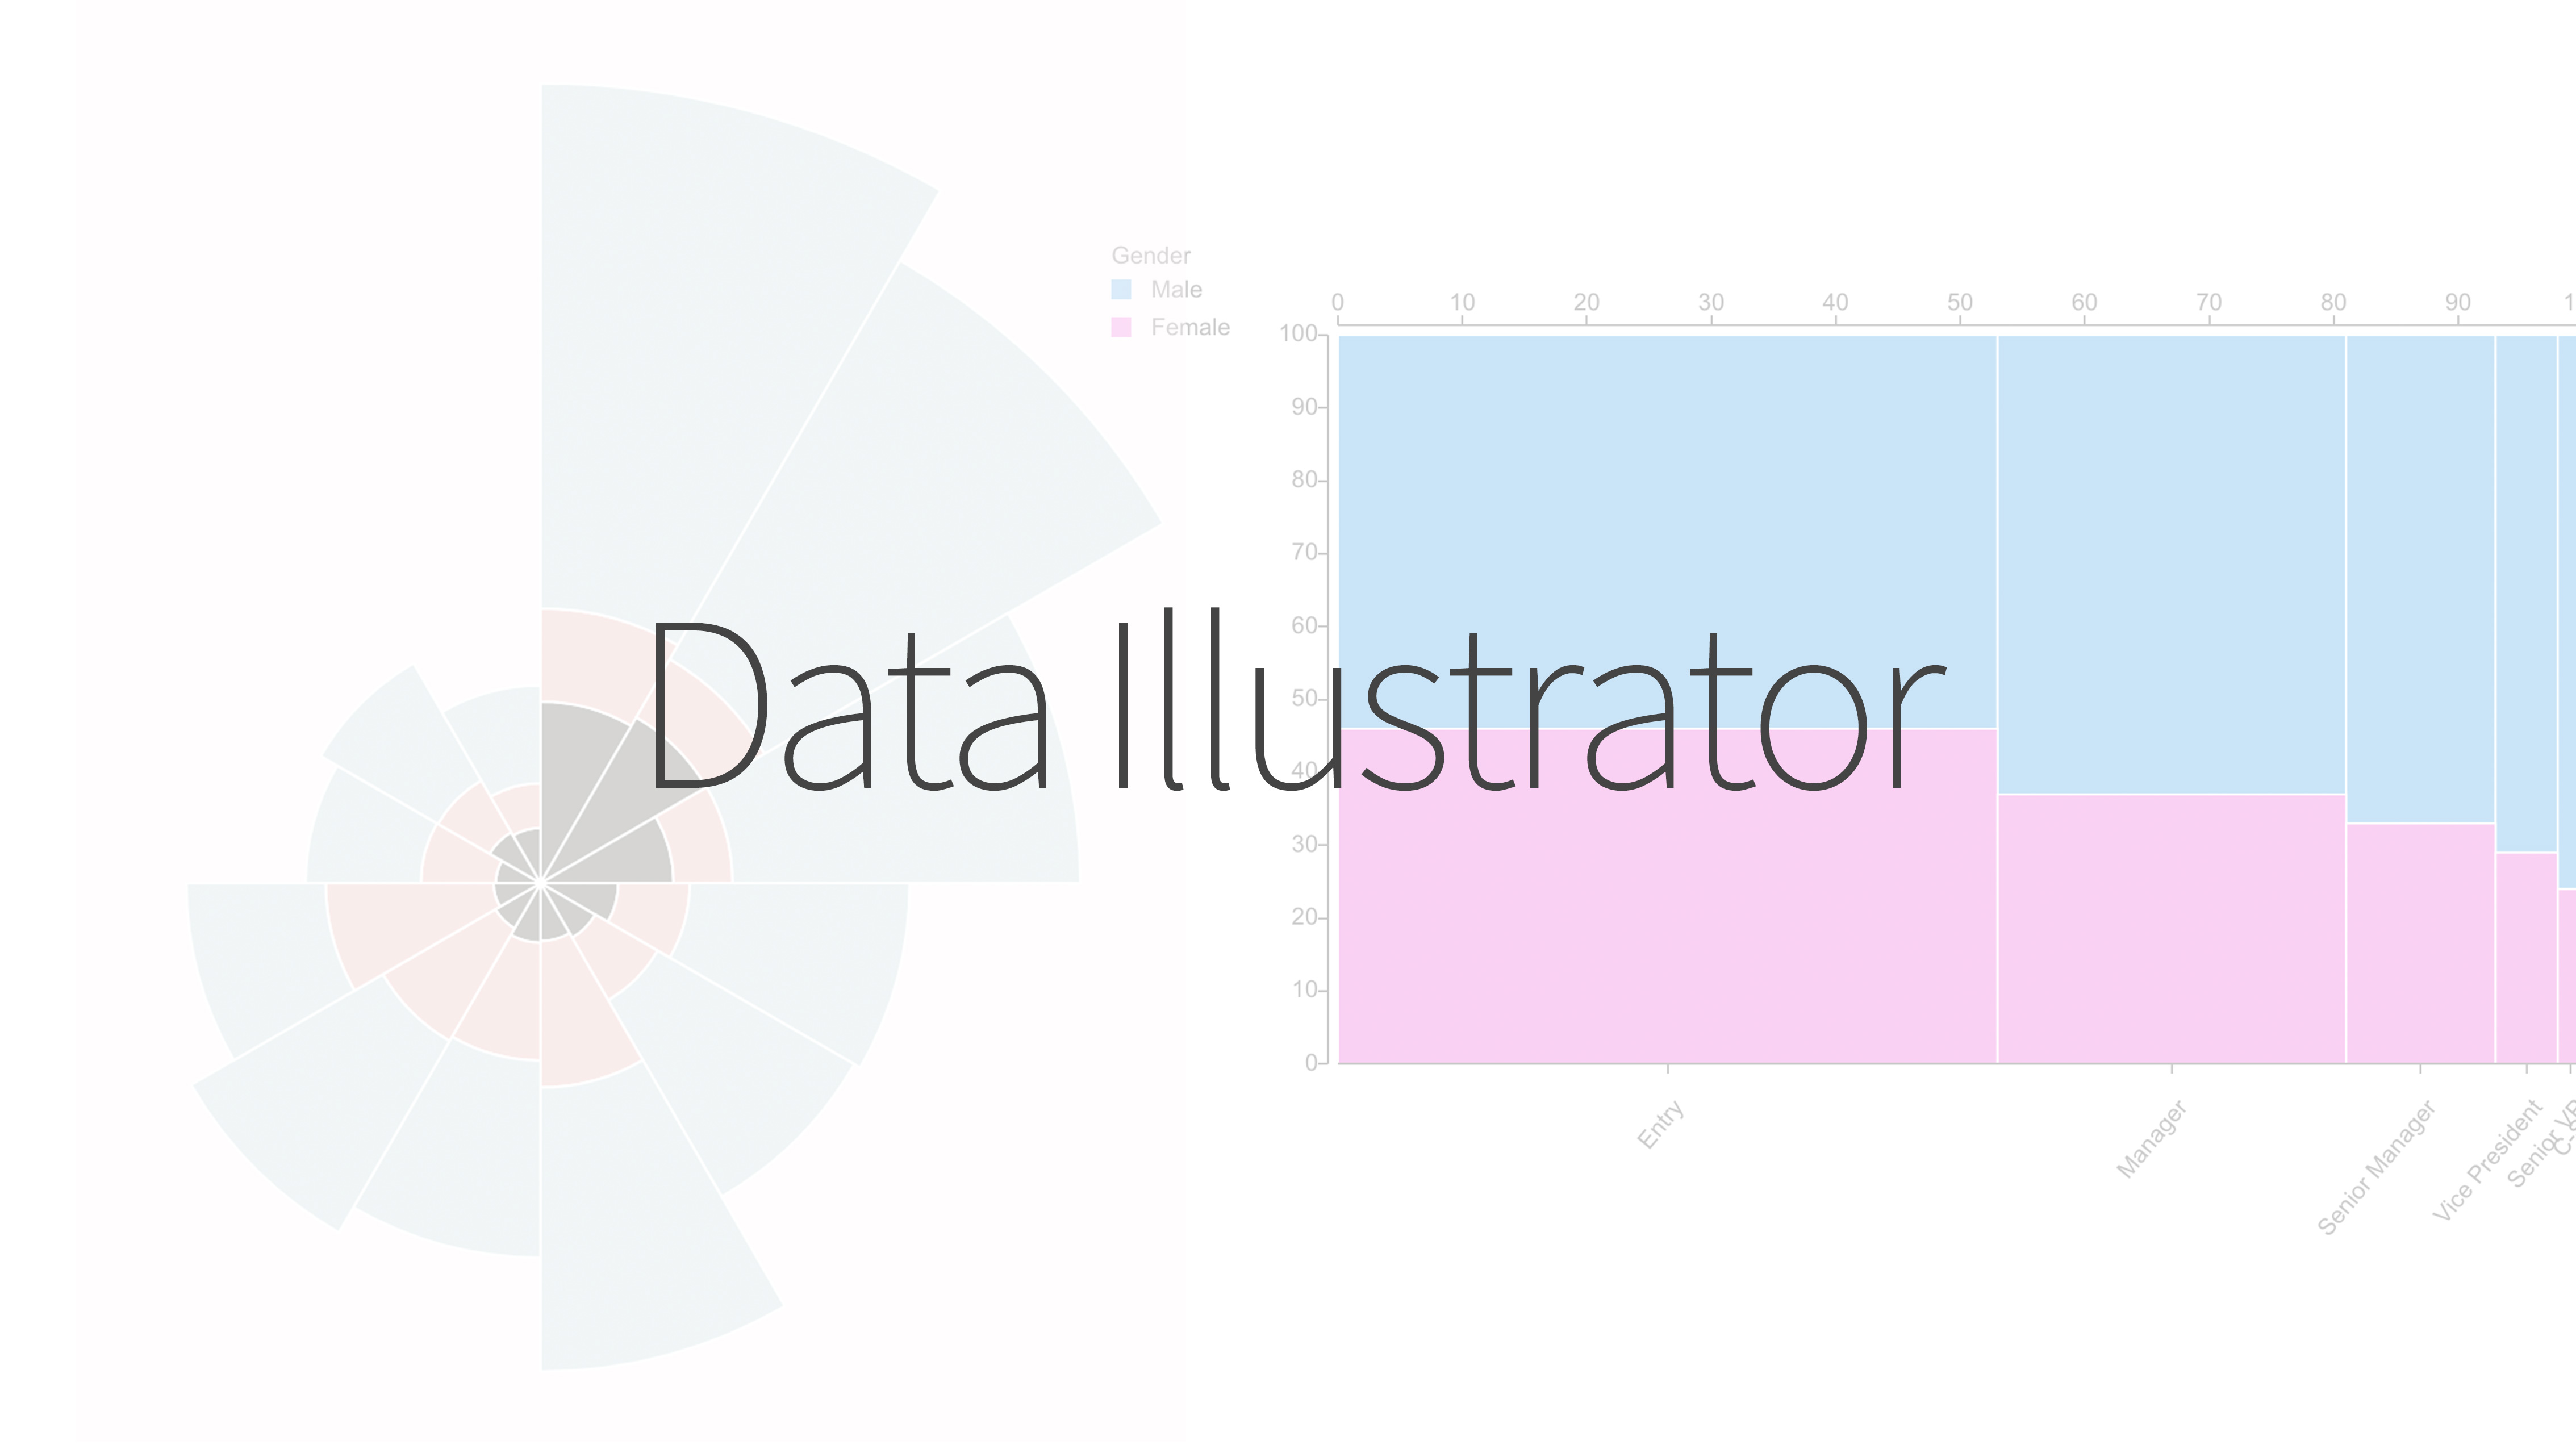
Tools that can create this chart…


A commonly used chart type. The horizontal axis represents time, and a non-time variable is assigned to the vertical axis. By connecting data points with lines, the slope of the lines visually conveys the magnitude of change.