← Back to Catalogue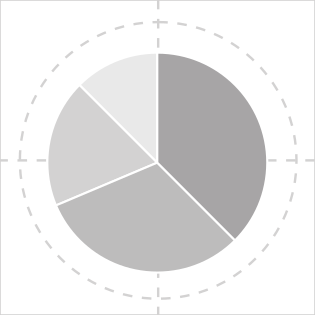
Pie Chart
Pie Chart
Numeric
Tools that can create this chart…


The angle within the circle represents the proportional size of data values. In recent years, there have been many negative opinions about its use, but it is perfectly fine as long as inappropriate practices are avoided, such as including too many items or distorting the appearance of proportions with 3D rendering.
The maximum number of items should be around six; if more are needed, consider using a different chart type.
There is also a variant called a donut chart, which has its center hollowed out. Since this makes it impossible to visually read angles, it is best avoided unless precise reading of values by angle is not critical or when it is used for effective presentation purposes.