← Back to Catalogue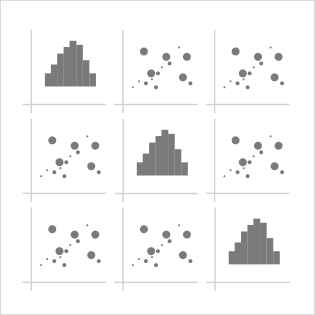
Scatterplot Matrix
Scatterplot Matrix
Numeric
Tools that can create this chart…

To exhaustively explore correlations among variables within a dataset, variables are arranged in a matrix and a scatterplot is drawn at each intersection using the corresponding pair of variables, enabling more efficient exploration.
When the two intersecting variables are the same, there is no need to examine correlation, so a histogram is displayed instead. Since the order of two intersecting variables does not matter, the same pair of variables appears in two locations. Rather than displaying the same scatterplot twice, one of the locations may show the correlation coefficient instead.