← Back to Catalogue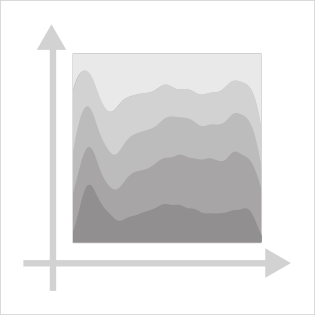
Stacked Densities
Stacked Densities
Numeric
Tools that can create this chart…

Multiple variables are displayed simultaneously using density plots, with the full display area representing 100% to show proportions. Unlike a 100% stacked bar chart, this chart can handle continuous variables on the horizontal axis. The vertical axis shows the results of kernel density estimation in relative terms.