← Back to Catalogue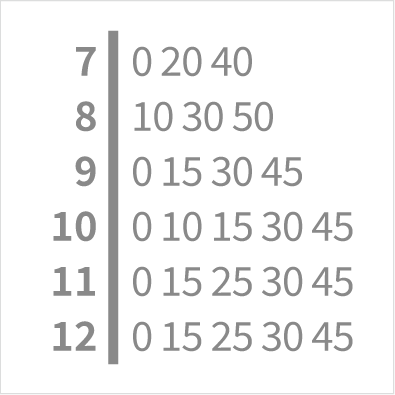
Stem and Leaf PIot
Stem and Leaf PIot
Text
The basic structure displays data values split into two parts. The stem represents the leading portion of the data and is usually arranged vertically. The leaf represents the detailed portion and is arranged horizontally. It resembles a histogram, but instead of showing the distribution with bars (area), the actual data values are written directly. A train station timetable is a perfect example of this chart.