← Back to Catalogue
Stream graph
Stream graph
Time
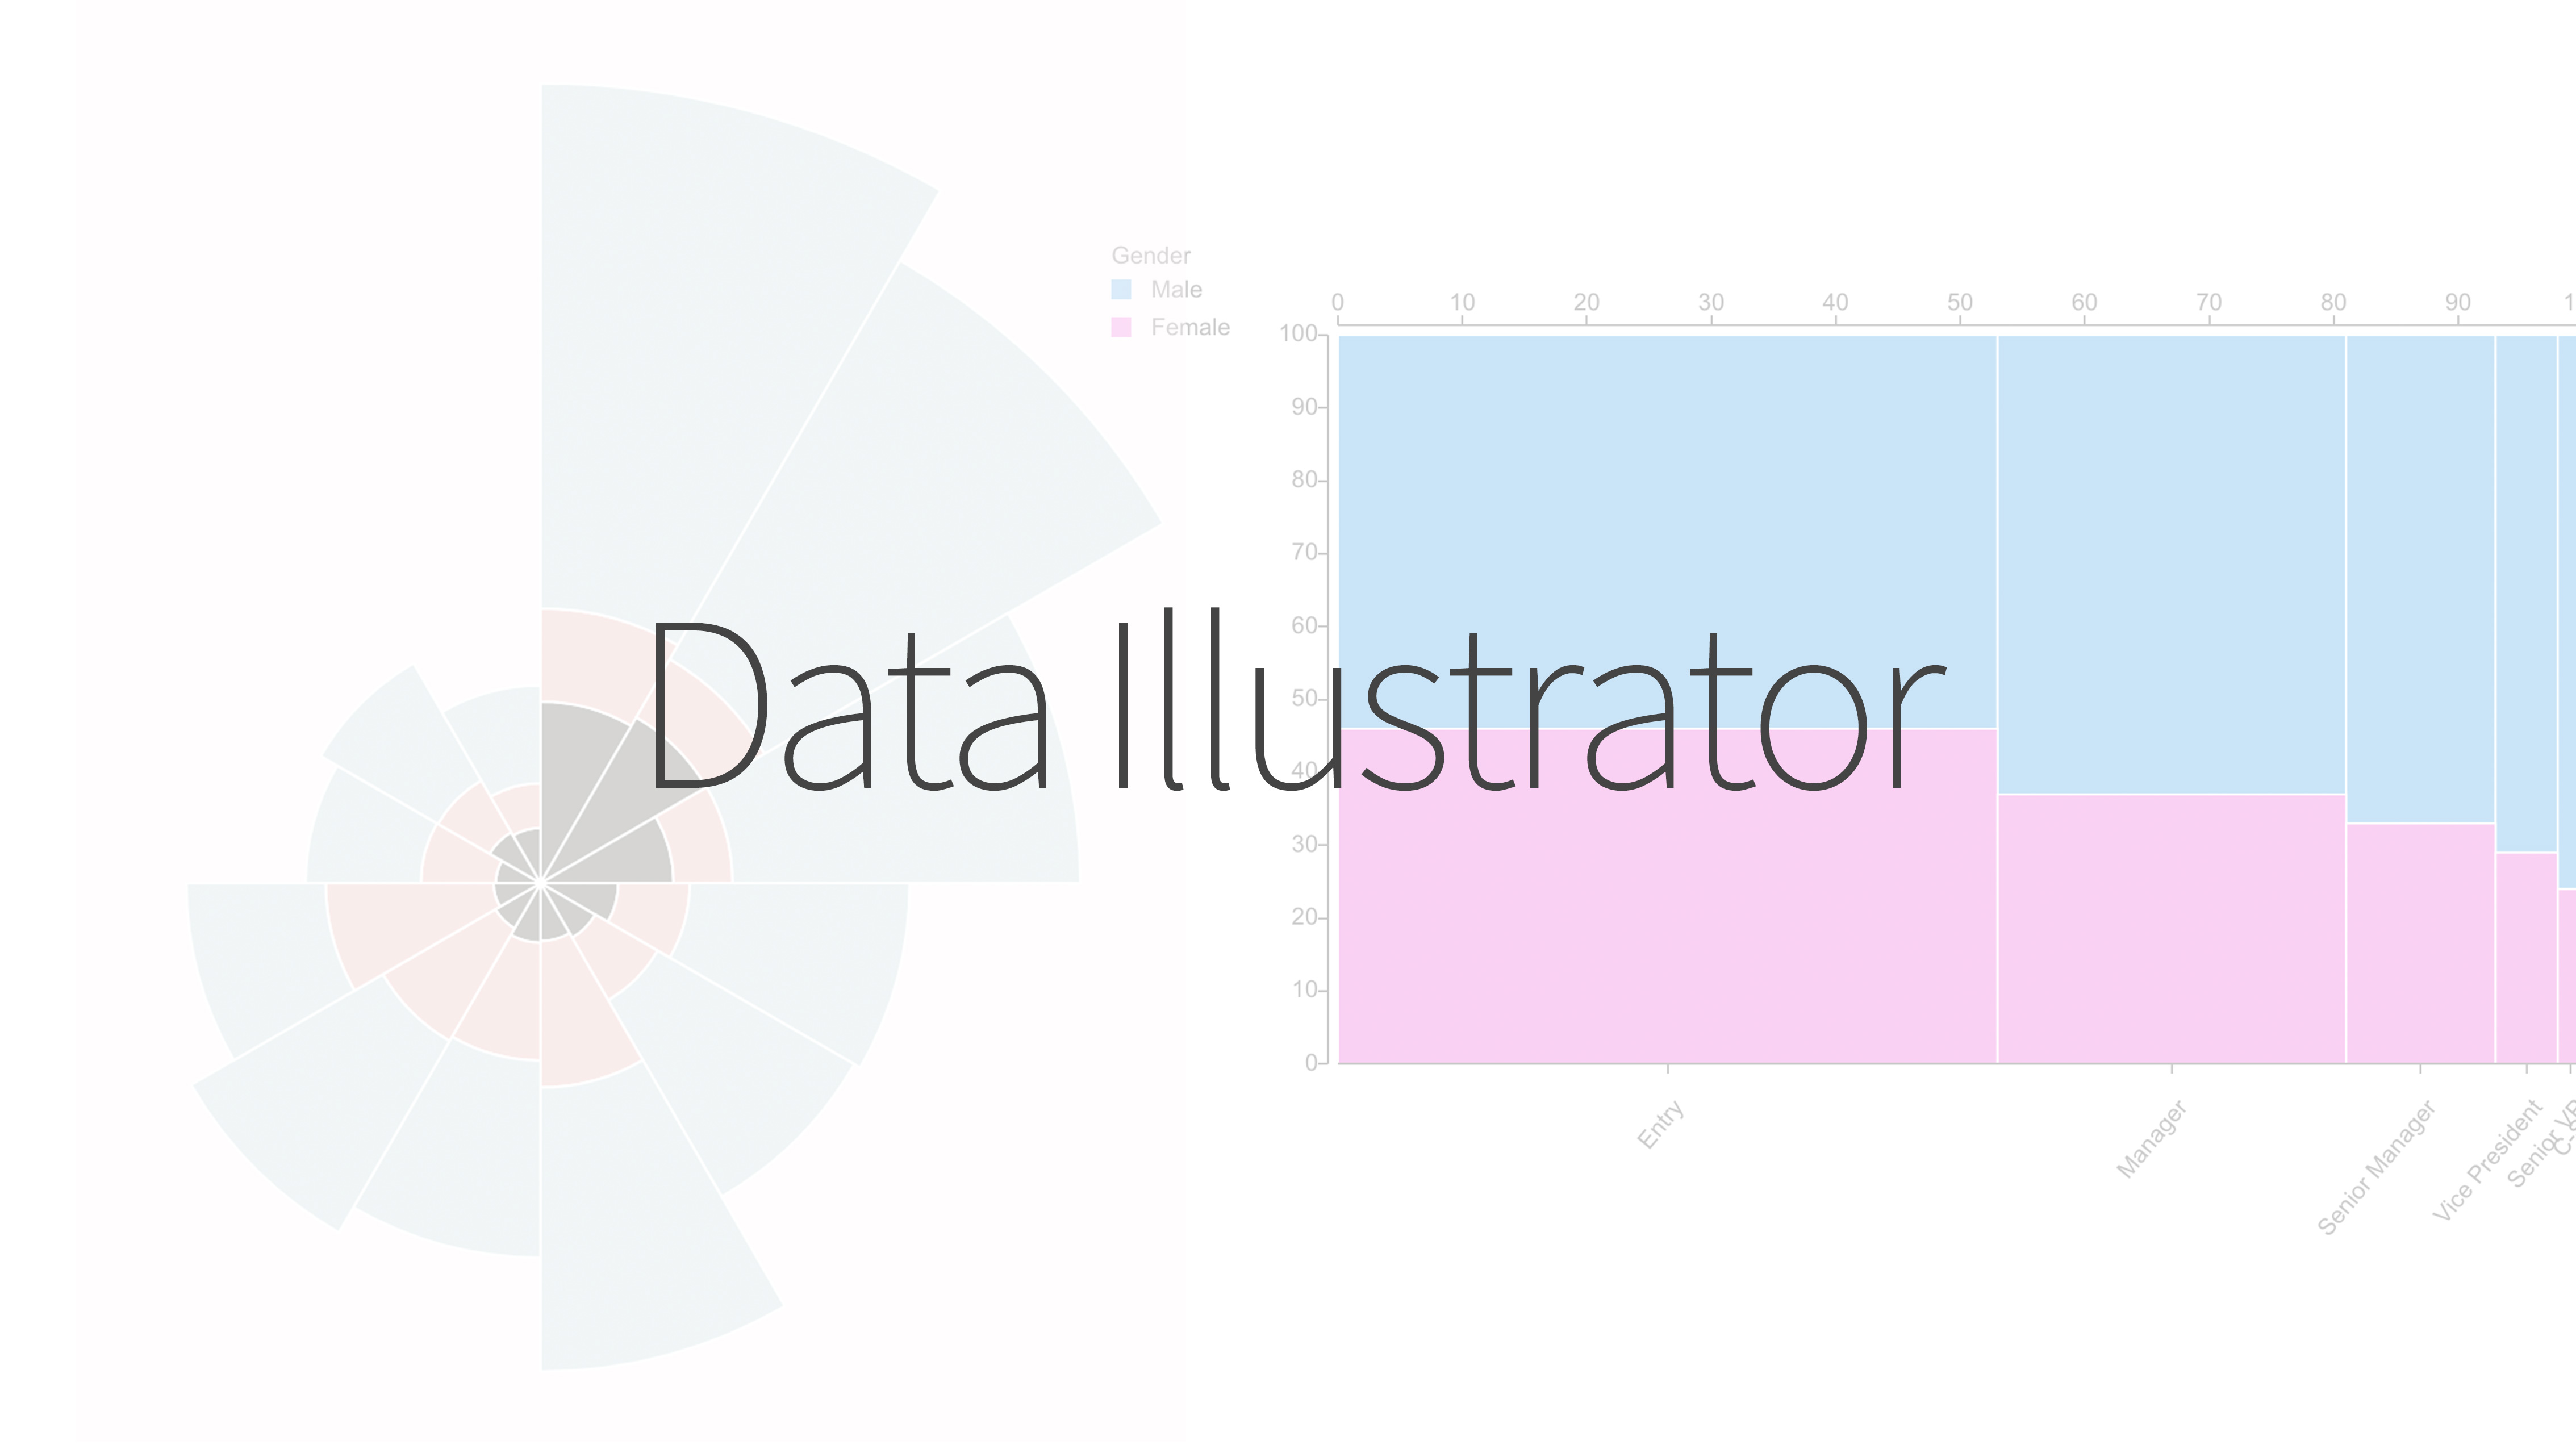
You can create this chart with…


Similar to a stacked area chart, but without an explicit horizontal axis. Instead, it uses both upward and downward directions from the baseline to display quantities as areas. Depending on the tool used, the shape of the graph may vary based on the order of columns in the input data file.