← Back to Catalogue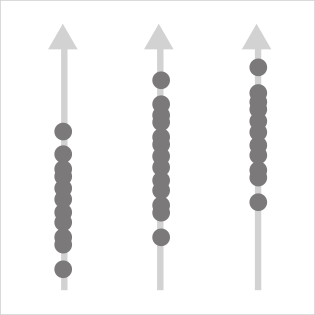
Strip Chart
Strip Chart
Numeric
Tools that can create this chart…

A one-dimensional scatterplot where each data point is plotted along a single line. Each data point is represented as one dot, showing the distribution of a single variable. Unlike a bee swarm plot, which spreads points organically to avoid overlap, data points are plotted within a pre-defined axis range.