← Back to Catalogue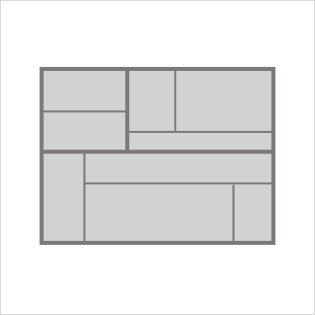
Treemaps
Treemaps
Structure
You can create this chart with…

An area-based, nested chart where each data item is represented as a rectangle. A well-known example is the chart showing market capitalization and stock price changes in the stock market.