← Back to Catalogue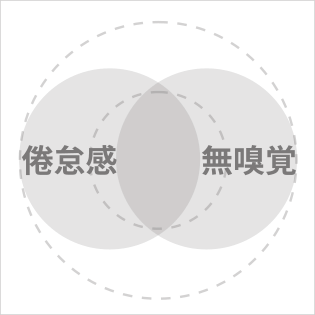
Venn Diagram, Euler Diagram
Venn Diagram, Euler Diagram
Text
Visualizes textual data belonging to multiple attributes (more like tags than categories, in the sense that items can belong to multiple attributes simultaneously). It is known as a diagram that uses closed curves (closed shapes formed by closed lines) to represent set-theoretic relationships.
A Venn diagram is used in mathematics, logic, and other fields when “all intersections of sets must be shown.” A chart that only needs to show the assumed combinations is called an Euler diagram.
While the name “Venn diagram” is more widely recognized, in practice Euler diagrams are used more frequently. It is worth noting this discrepancy.