← Back to Catalogue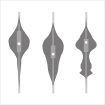
Violin Plot
Violin Plot
Numeric
You can create this chart with…

A density plot is mirrored and placed back-to-back, with the equivalent of a box plot drawn inside. The bottom end represents the minimum value, and the top end represents the maximum value. It allows for a more detailed understanding of the data than a box plot.