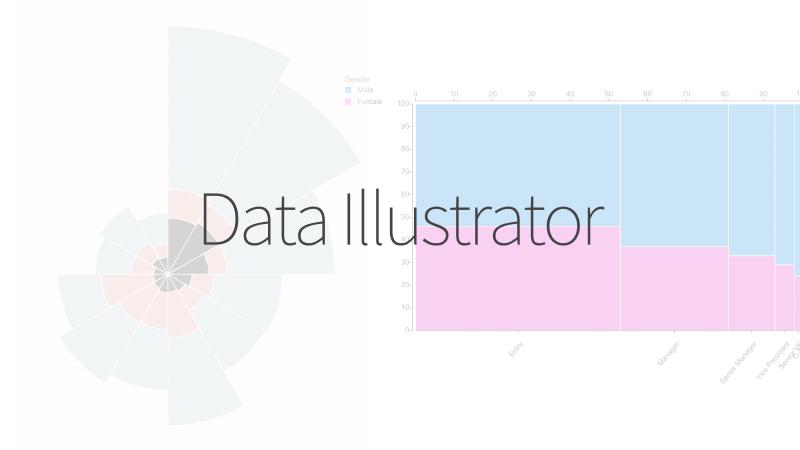

What is this tool?
Data Illustrator is a web application that lets you create data visualizations visually without programming. It aims to generate charts with the feel of drawing graphics using vector design operations, similar to Figma or Adobe Illustrator.
Features
- An intuitive, vector-design-like interface for drawing, selecting, and manipulating.
- Supports data binding (linking data to graphics).
- Automatic visual encoding: Assign data columns to visual attributes such as color, shape, and position for instant rendering.
- UI components including Canvas, Data Panel, Layers Panel, and Property Inspector enable editing and structuring.
How to use
- Import data and display the data table.
- Draw, select, and edit shapes.
- Bind data columns to shape attributes such as position, color, and size. Updates are reflected immediately.
- Export or save the created visualization.
Data formats
- Tabular data (CSV)