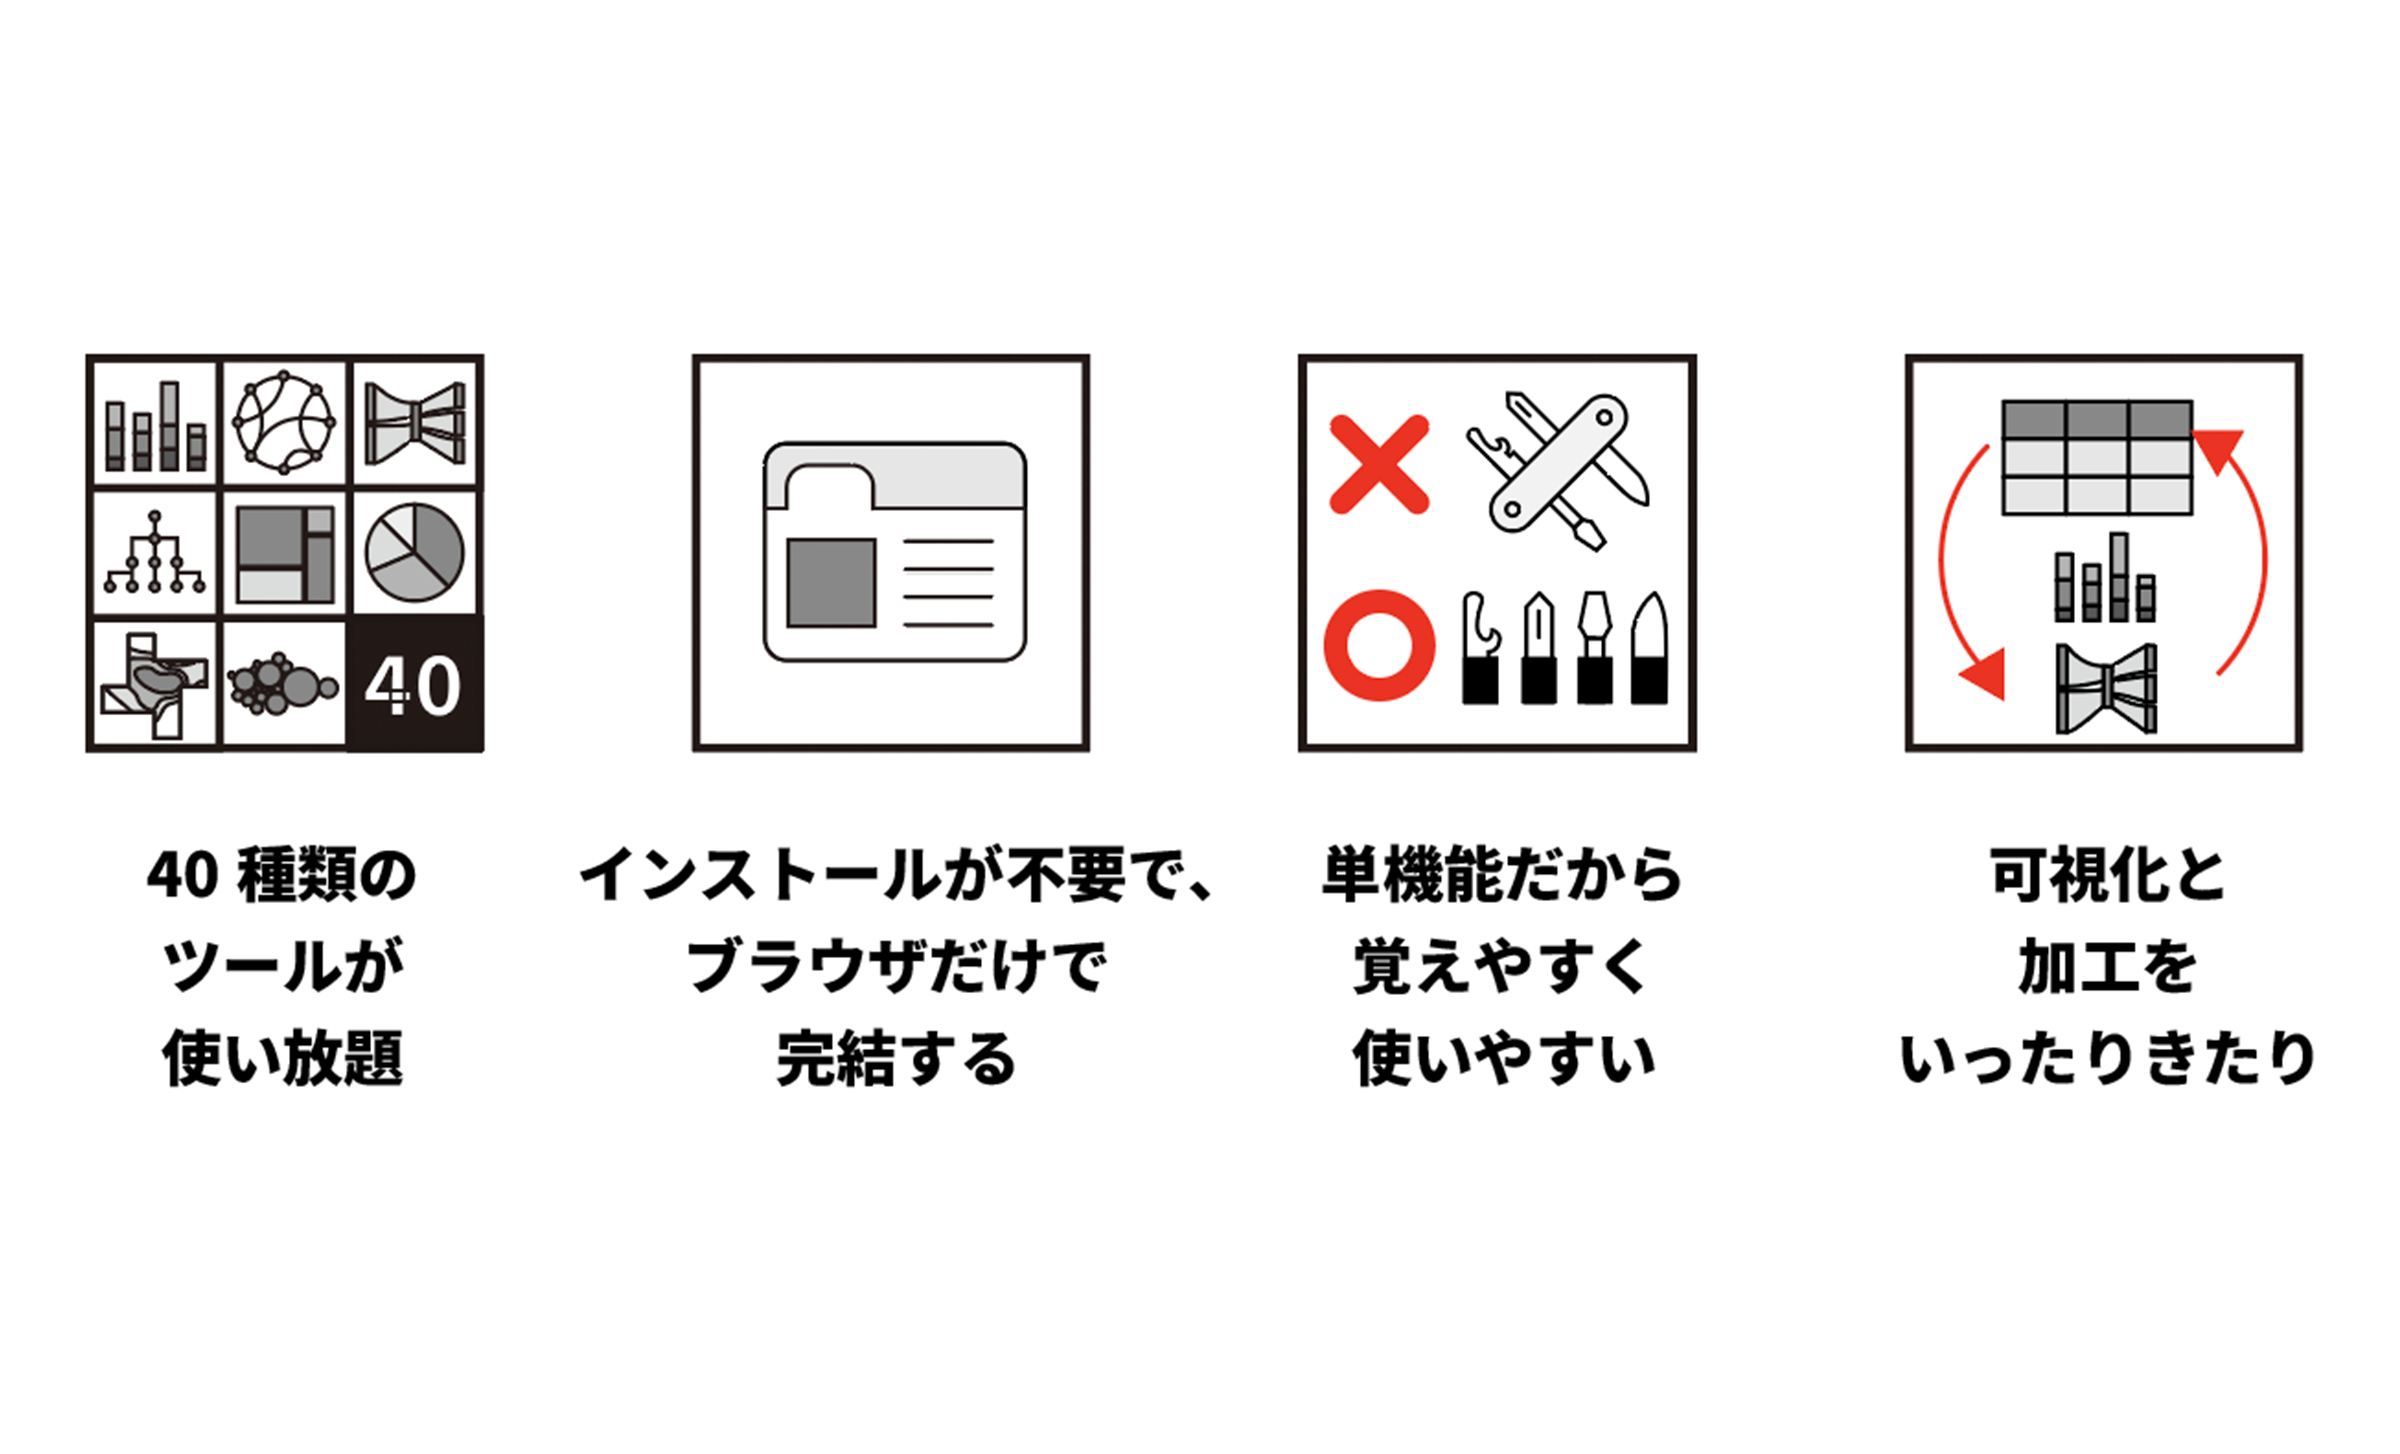
Data Visualization Toolbox gives you unlimited access to a broad collection of focused data visualization tools through one subscription.
- A broad visualization toolkit
- Focused tools that are easy to learn
- Explore different visual forms
- New tools and updates
A broad visualization toolkit
Create familiar charts as well as data maps, network diagrams, text visualizations, color systems, 3D views, and other specialized visual forms. The collection is designed to cover visualization tasks that are difficult to complete with general-purpose spreadsheet or BI software.
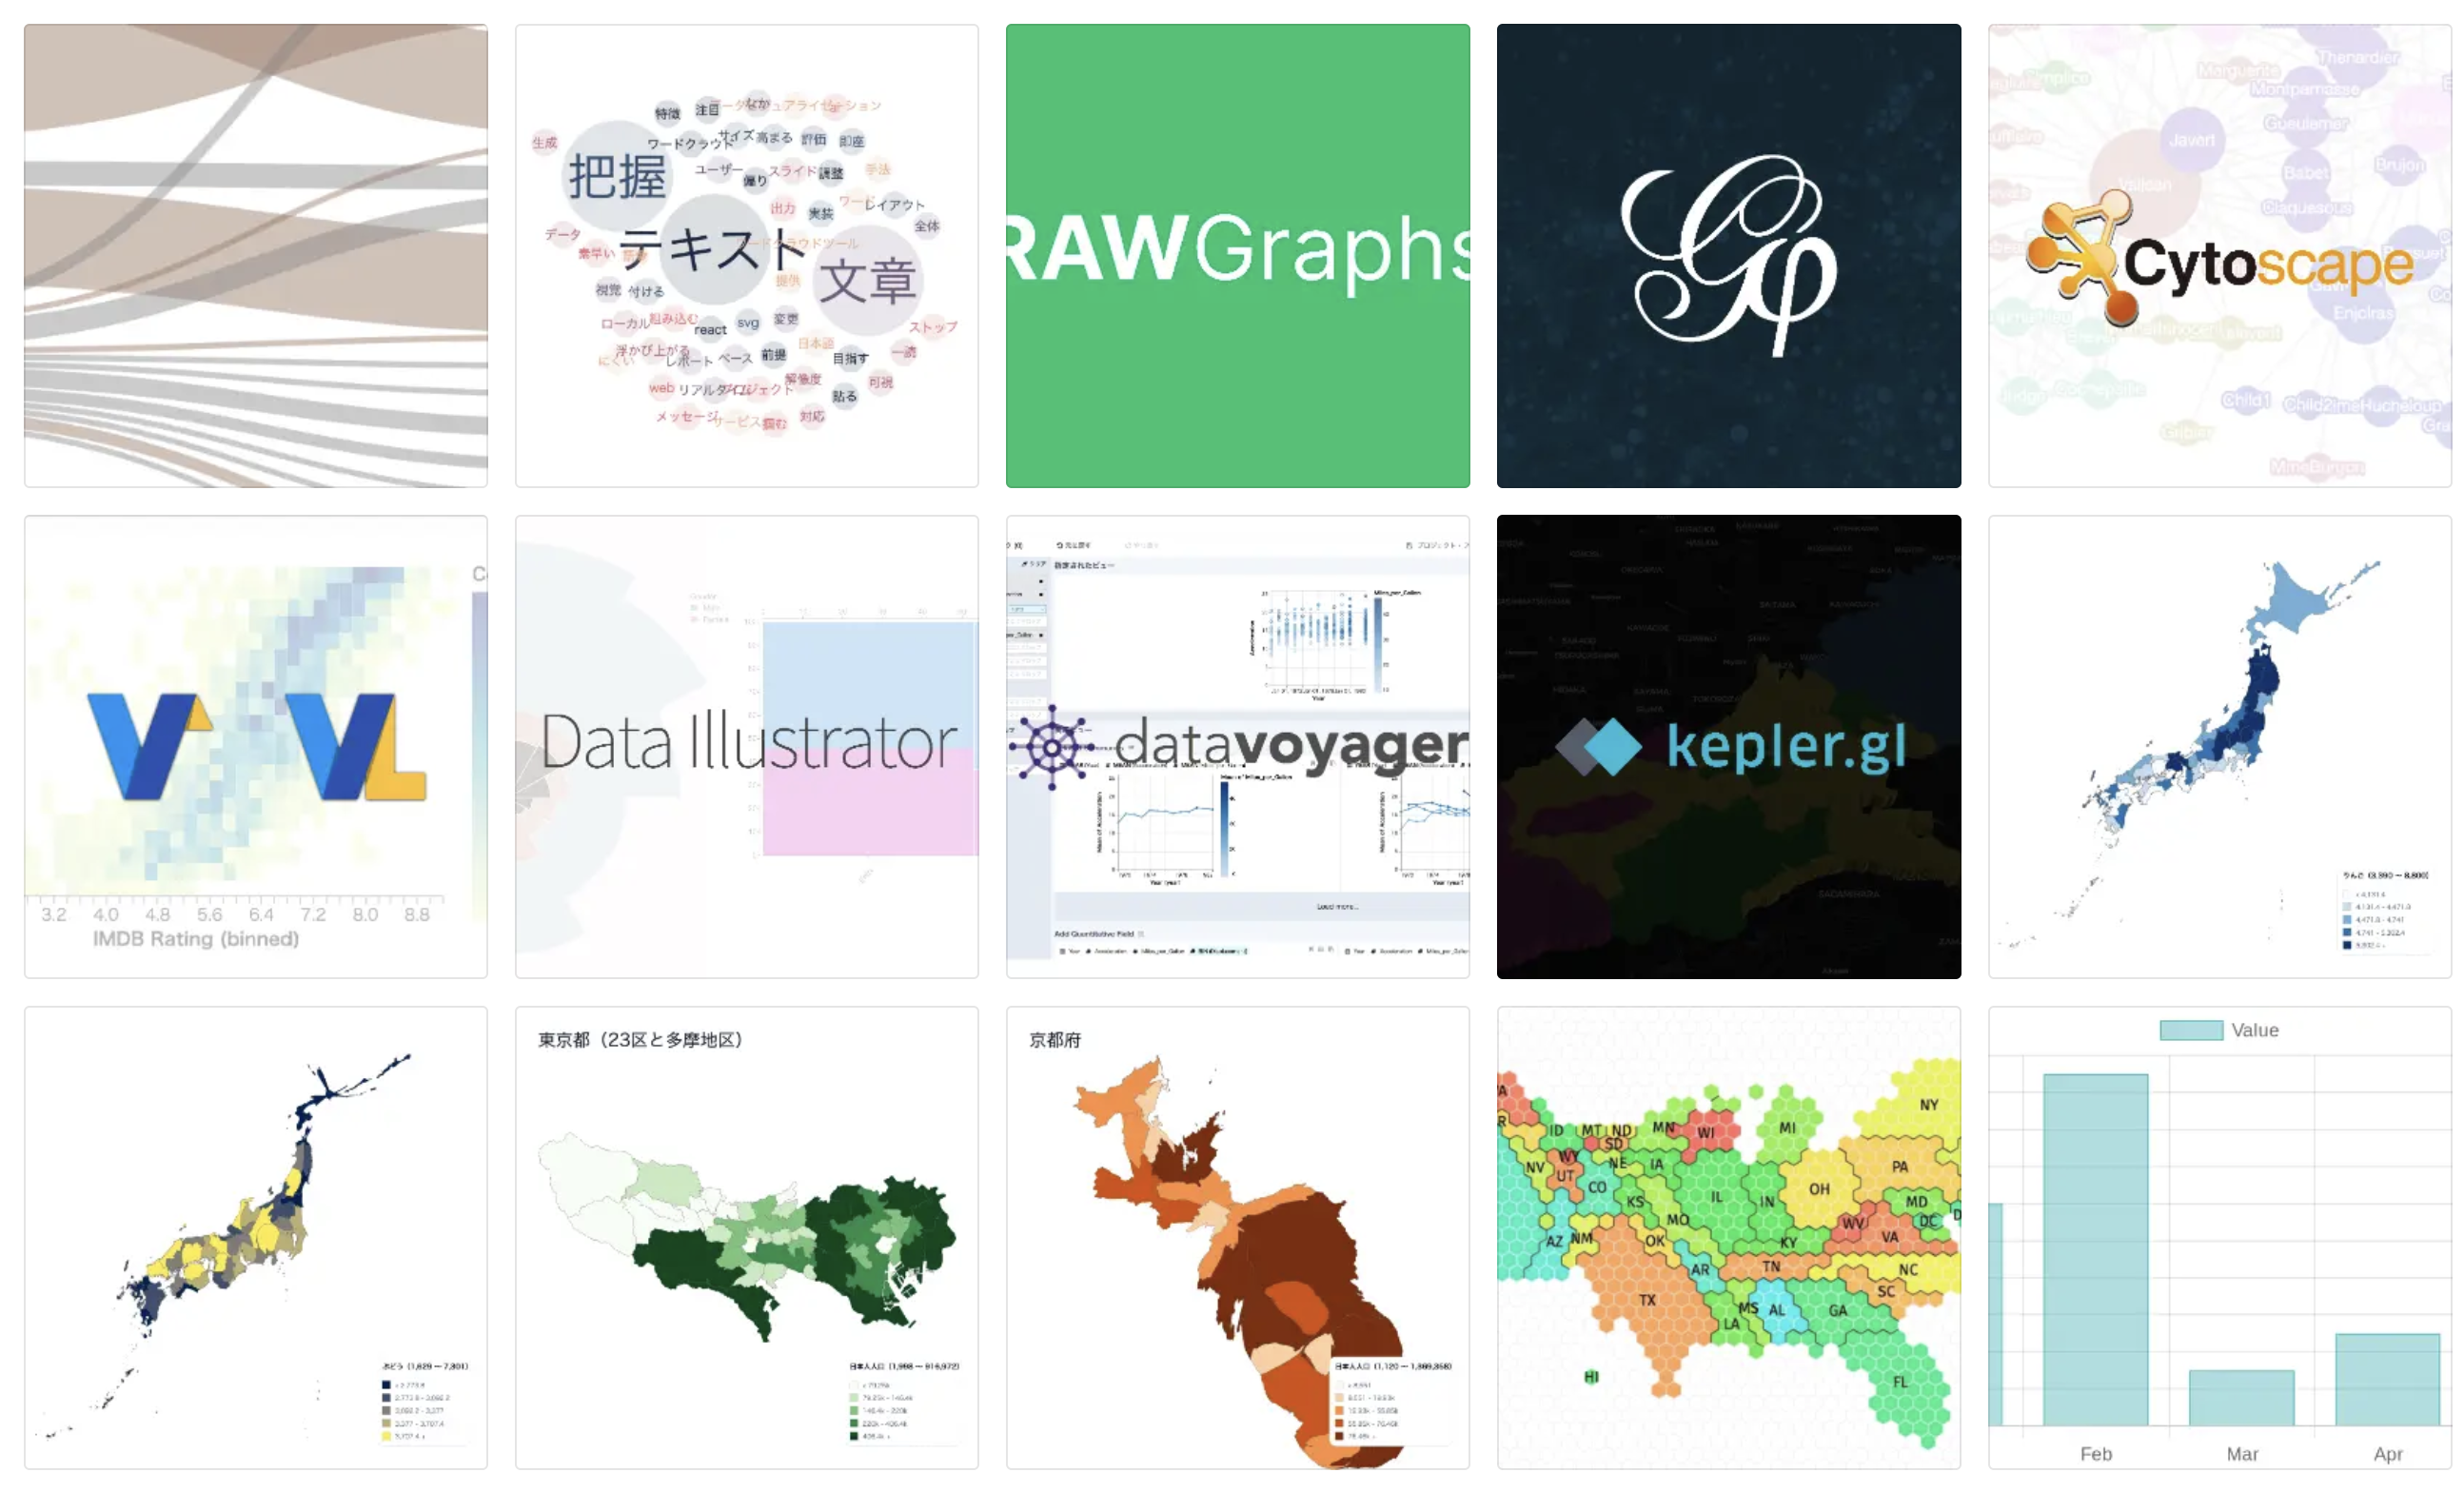
Data visualization tools
Focused tools that are easy to learn
Each tool is designed around a clear, focused purpose. You can choose the tool that matches your task and start working without first learning a large application.
This focused approach also makes it easier for teams whose members have different levels of data literacy to use a shared toolset.
Explore different visual forms
The same dataset can reveal different patterns depending on whether it is shown as a chart, map, network, or text visualization. Moving between focused tools makes it easier to test these alternatives and choose the form that communicates the data most clearly.
New tools and updates
The collection is updated as visualization methods and practical needs evolve. Tools added to the visualization service are available within the applicable subscription plan.
See the Changelog for recent additions and updates.