Let’s find the “ideal yogurt” — high in protein, low in sugar.
With a Parallel Coordinates chart, you can easily filter data by applying multiple conditions simultaneously.
Here we show how to create this using our tools.
Paid subscribers can open the link above as an editable project file to learn the process and examine the data structure.
Collecting the Data
First, we gathered nutritional information for yogurts sold at convenience stores, collecting data from each manufacturer’s website.
Visualizing with Parallel Coordinates
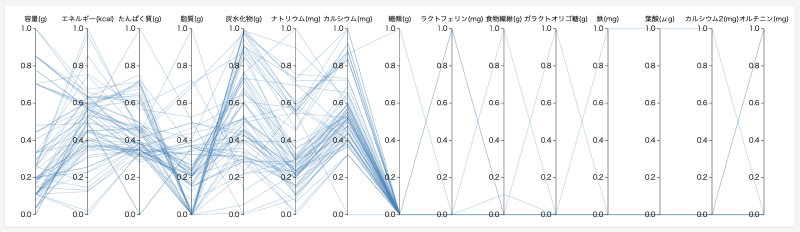
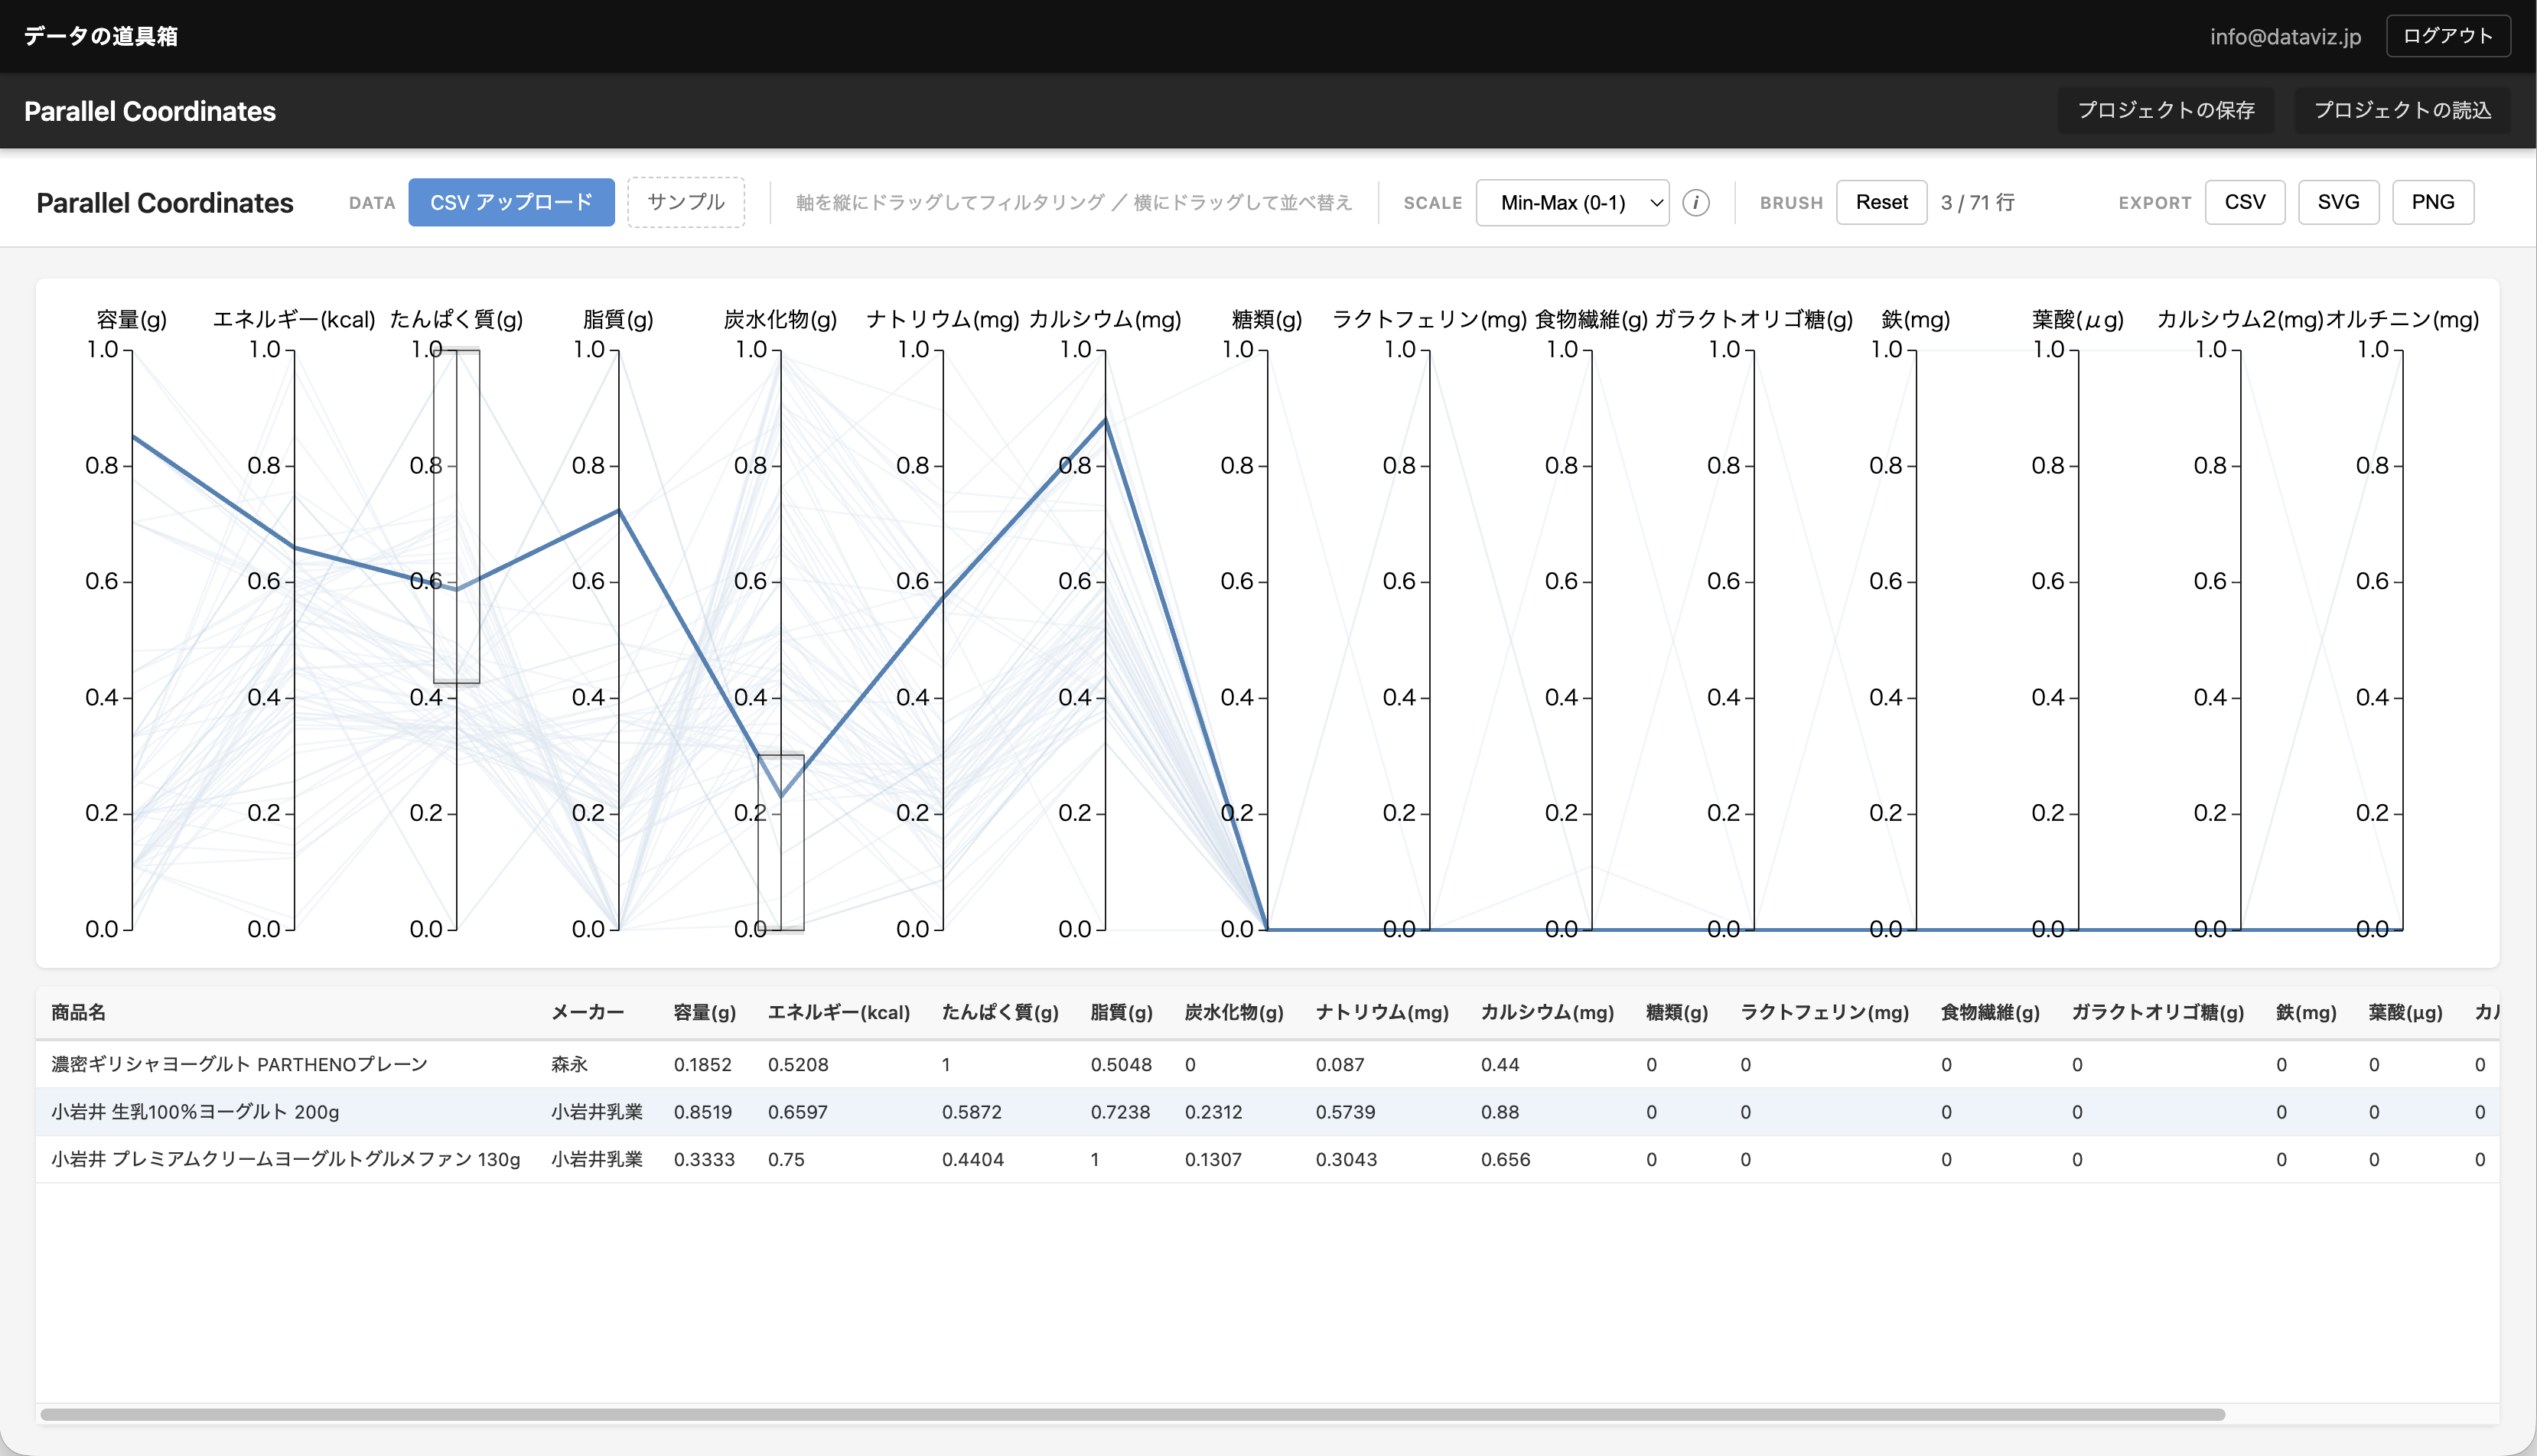
After loading nutritional data for 70 yogurt products and switching to Min-Max scale, metrics with different units are normalized to the same 0–1 axis.
Filtering Across Multiple Axes
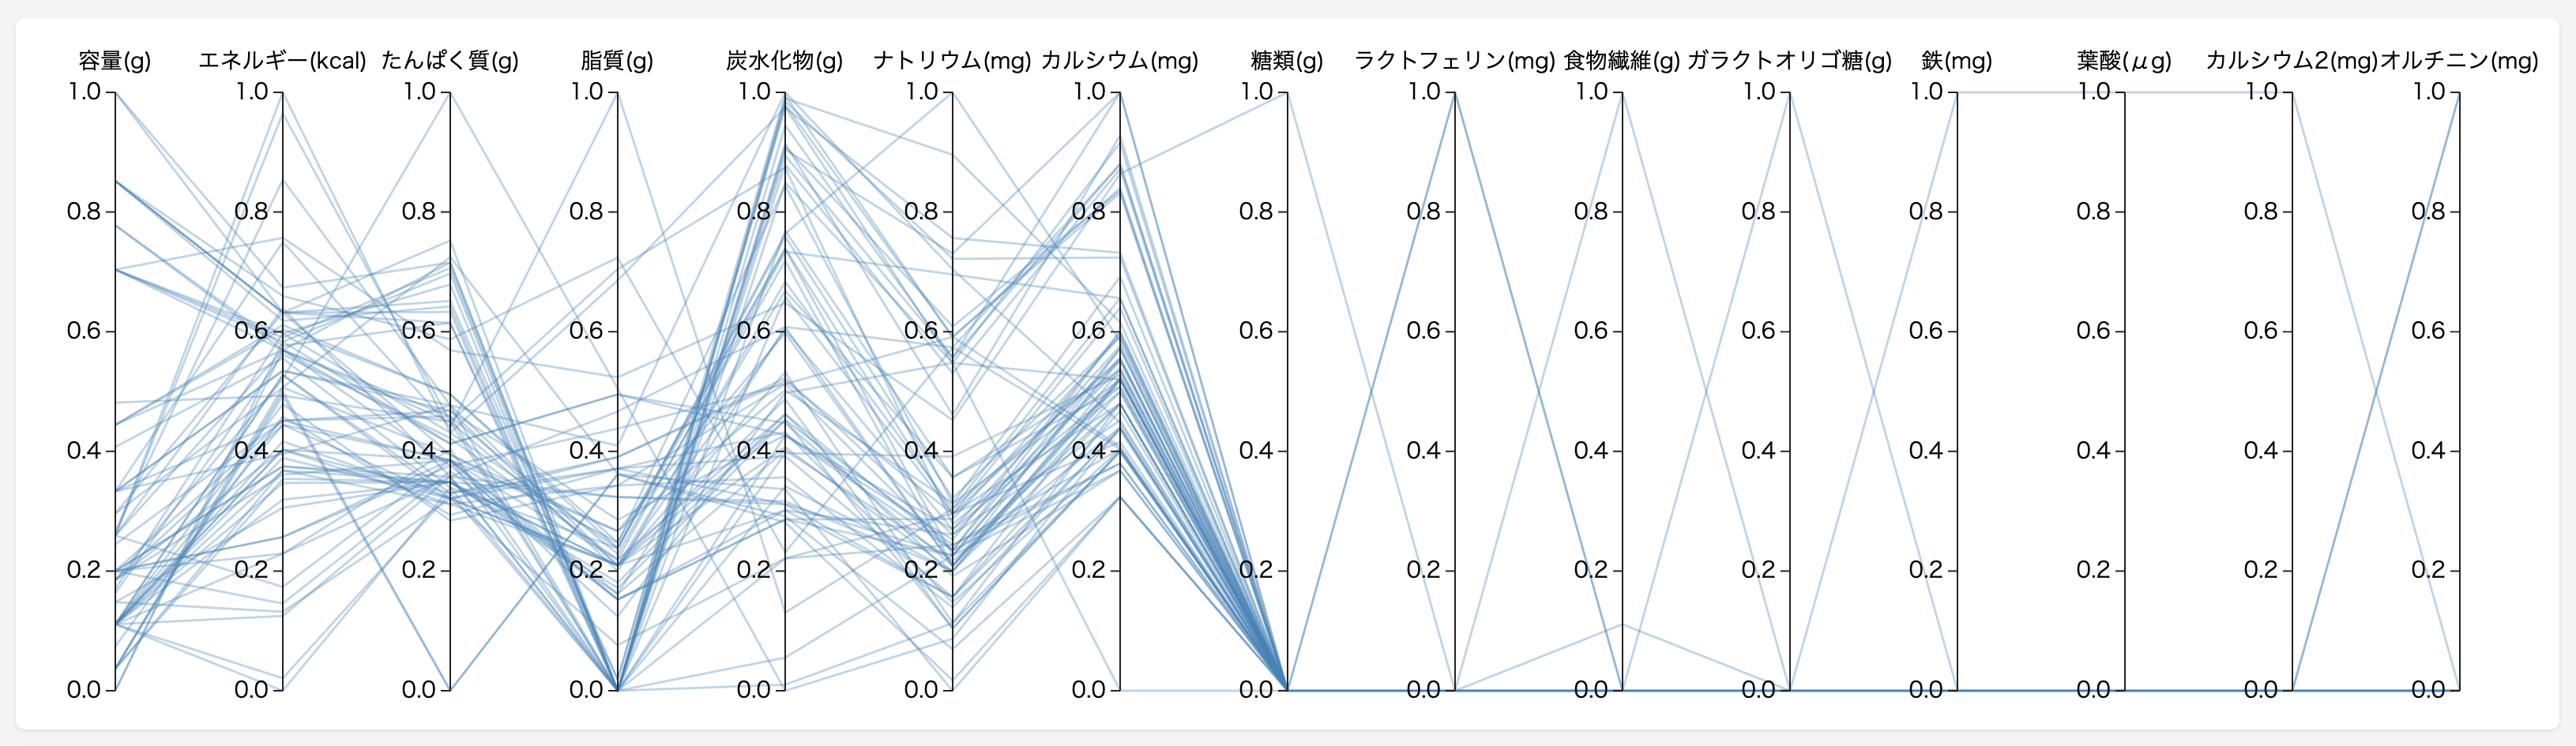
By brushing the upper range on the protein axis and the lower range on the carbohydrate axis, only products meeting the “high protein, low sugar” criteria remain as blue lines.
The standout result is PARTHENO Plain, a rich Greek yogurt — 10.9g of protein with just 4.6g of carbohydrates.
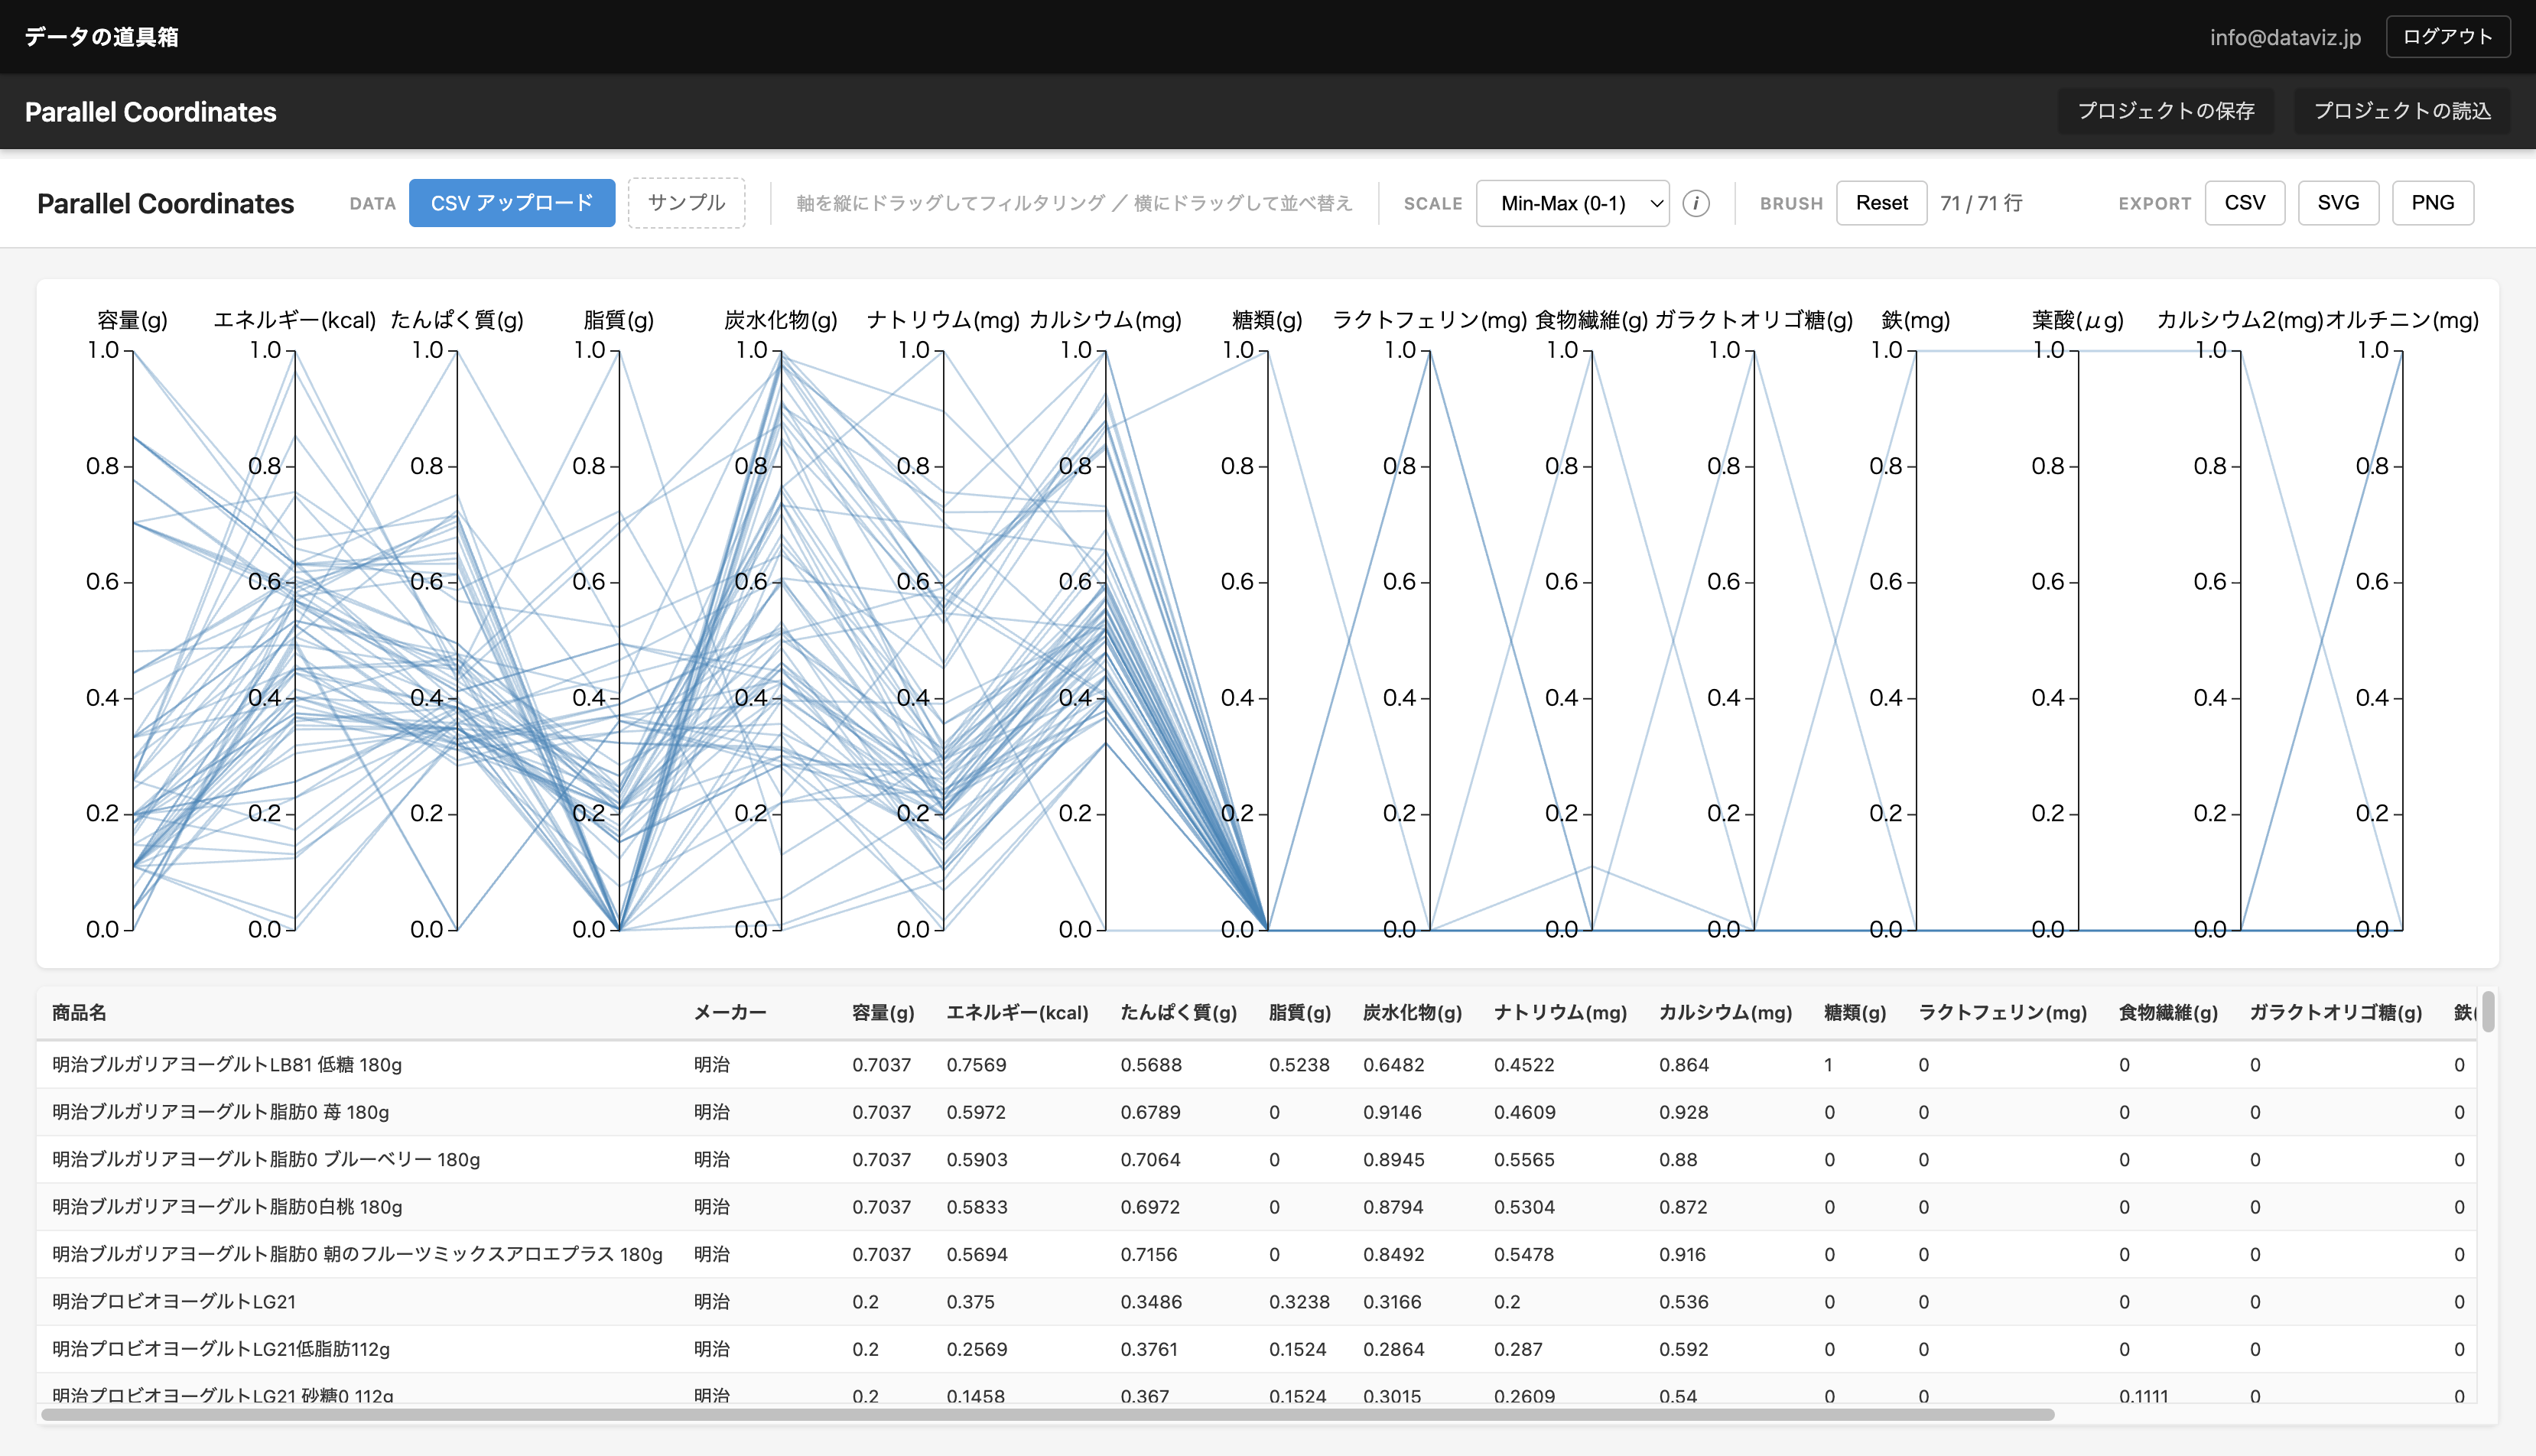
Reordering Axes
Try dragging axes to rearrange them, and hover over table rows to highlight the corresponding lines. Experience how the “feel” of the data changes with different arrangements.