
What is this tool?
A tool that lets you create a wide variety of charts with an intuitive interface. While it is not designed for fine-tuning charts on its own, it excels as a drafting tool for exporting in SVG format and refining in graphic tools (such as Figma or Adobe Illustrator) or PowerPoint.
A missing link tool that bridges the gap between Excel and graphic applications like Adobe Illustrator.
Features
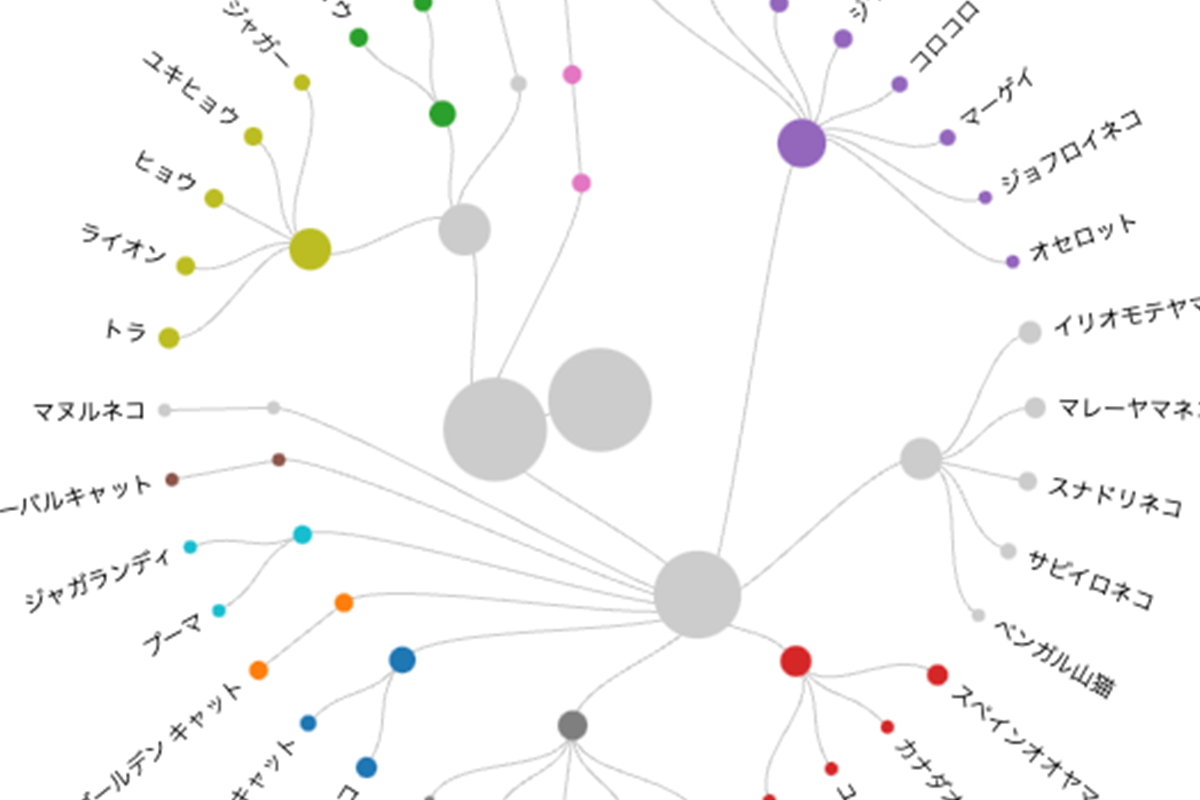
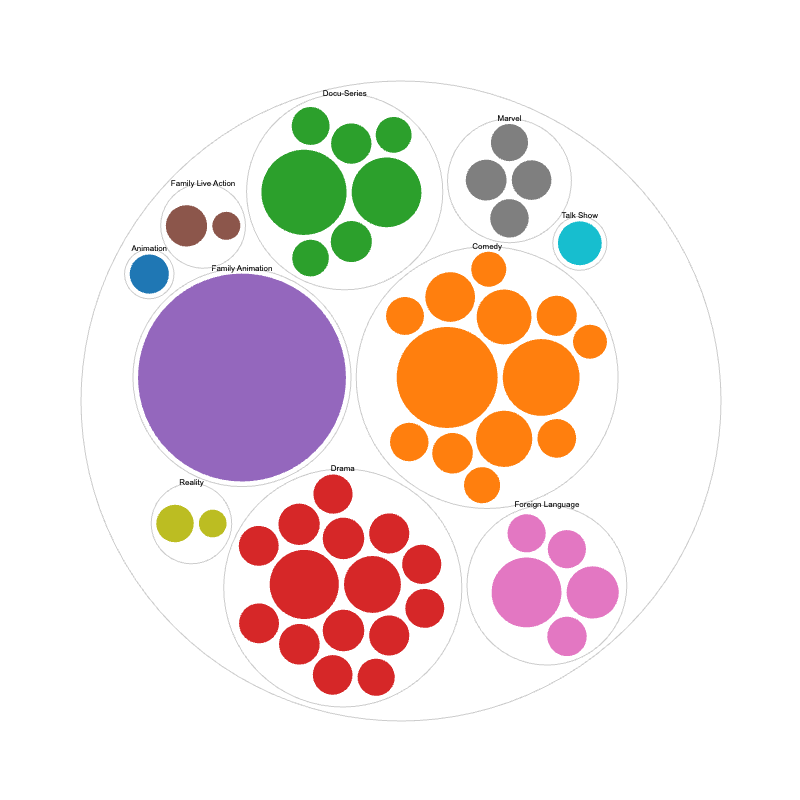
- 32 diverse chart templates across 8 categories
- Export as PNG, JPEG, or SVG images
- Style adjustments
- No interactive content creation capabilities
- Save and load created projects
How to use
- Load your data
- Choose a chart
- Map the data
- Customize
Data formats
- Tabular data (CSV, TSV, DSV)
- JSON
Note
Drag operations may not work properly when using Microsoft Edge. In that case, please use another browser such as Chrome.