What is this tool?
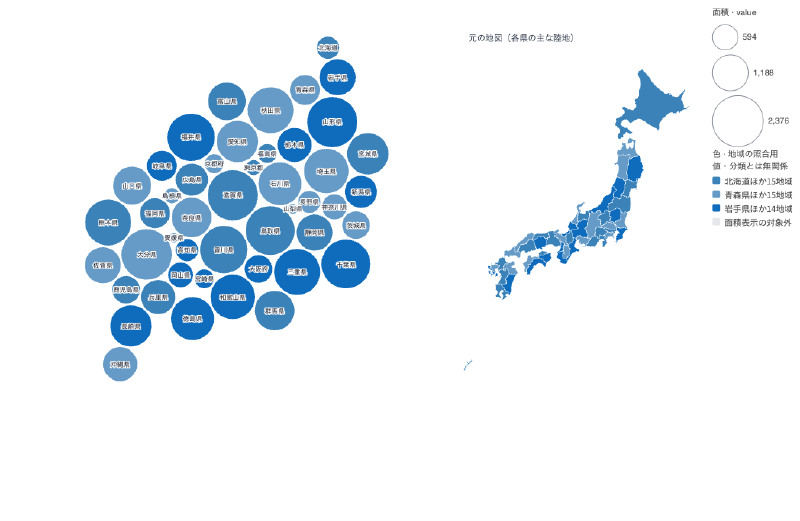
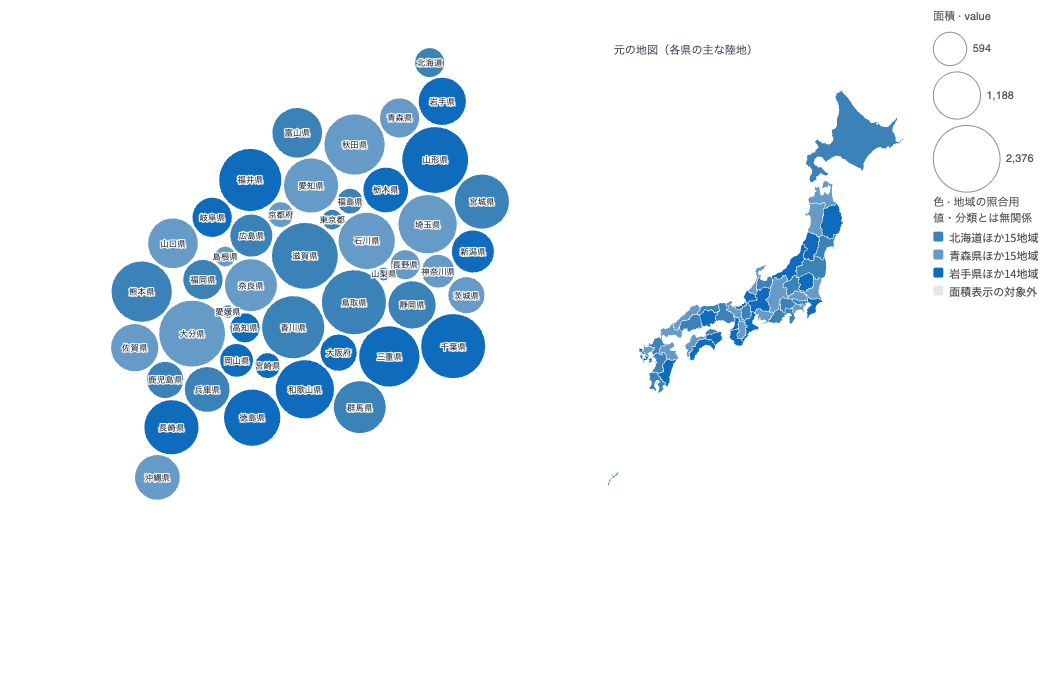
This tool represents values for Japan’s 47 prefectures using proportional circle (Dorling) or square (Demers) areas. It helps compare regional differences in population or counts while referring to geographic positions. Each prefecture is represented by the same type of shape, rather than a distorted regional outline.
Features
- Switch between circles (Dorling) and squares (Demers)
- Scale shape areas in proportion to prefecture values from a CSV
- Compare the cartogram with the original map
- Show all labels, or omit labels on small shapes
- Use the dataset name as the default title, synchronized with annotation settings
- Read values and visual encodings with a shared legend
- Export editable SVG and PNG images
Cloud saving and sharing are being prepared.
How to use
- Load a CSV containing values for Japan’s 47 prefectures.
- Check the prefecture and value mapping, then choose circles or squares.
- Compare with the original map and adjust labels, title and annotations.
- Export SVG or PNG. The exported SVG remains editable.
Data format
- Tabular data (CSV)
- Include a column identifying prefectures and a numeric column to determine shape areas.
- Covers Japan’s 47 prefectures.
The sample uses fictional values for comparison. The original map uses generalized Natural Earth boundaries and shows each prefecture’s main landmass; it does not show every island or establish legal boundaries.