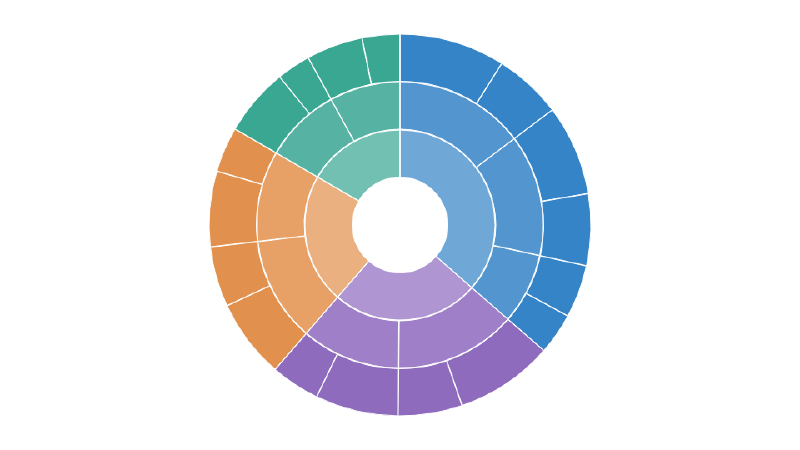
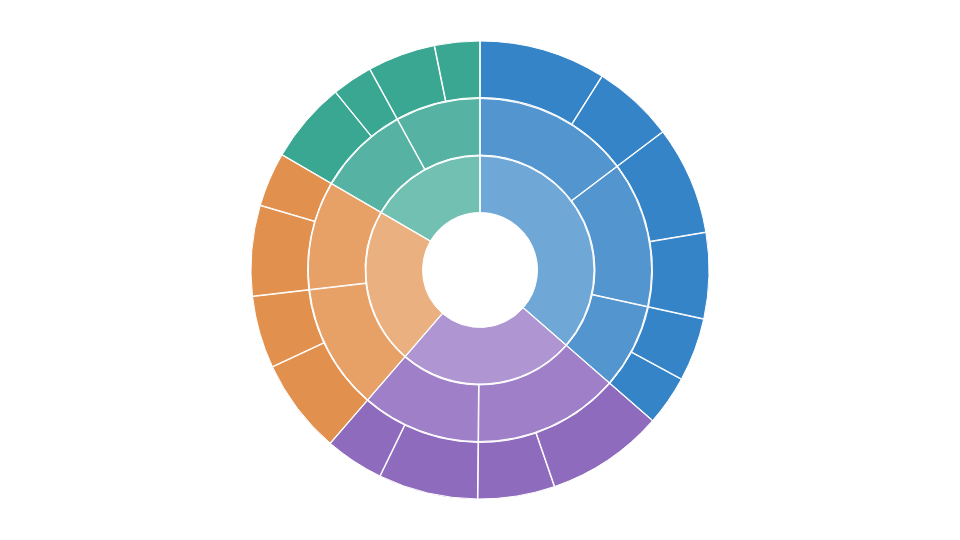
What is this tool?
Create four kinds of hierarchical visualization: treemap, radial tree, icicle chart, and sunburst. Choose a chart to show how categories connect or how values are distributed across levels.
Features
- Chart picker: compare areas with a treemap, show branching relationships with a radial tree, arrange levels as bands in an icicle, or compare proportions in concentric rings with a sunburst
- Data input: upload CSV / TSV / JSON, paste text, or load samples suited to the selected chart
- Mapping: choose hierarchy and value columns. Classification tables without numeric values can count each row as one item
- Appearance: adjust colors, labels, and layout; add a title and source
- Interaction: select elements in treemaps, icicles, and sunbursts to zoom into a hierarchy
- Export: SVG / PNG
- Project save: store data and settings in the cloud and restore them later
How to use
- Pick a chart on the catalog page
- Load a sample, or upload or paste CSV / TSV / JSON
- Check the hierarchy and value columns in Mapping
- Adjust the style and annotations
- Export SVG / PNG or save the project
Data format
For tabular data, use hierarchy columns containing categories and a numeric value column. Data without numeric values can be aggregated by row count.
Category,Subcategory,Item,Value
Research,Natural sciences,Climate,28
Research,Natural sciences,Ocean,18
Education,Public courses,Online,22
JSON supports both arrays of tabular objects and nested hierarchies using name and children.