What is this tool?
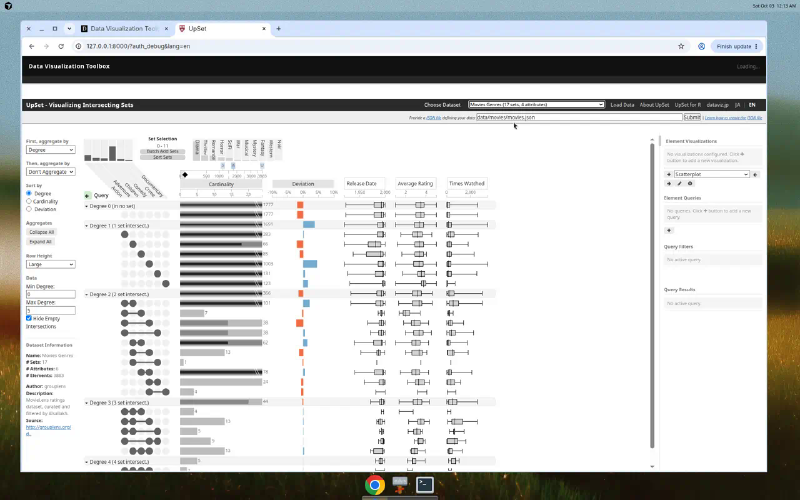
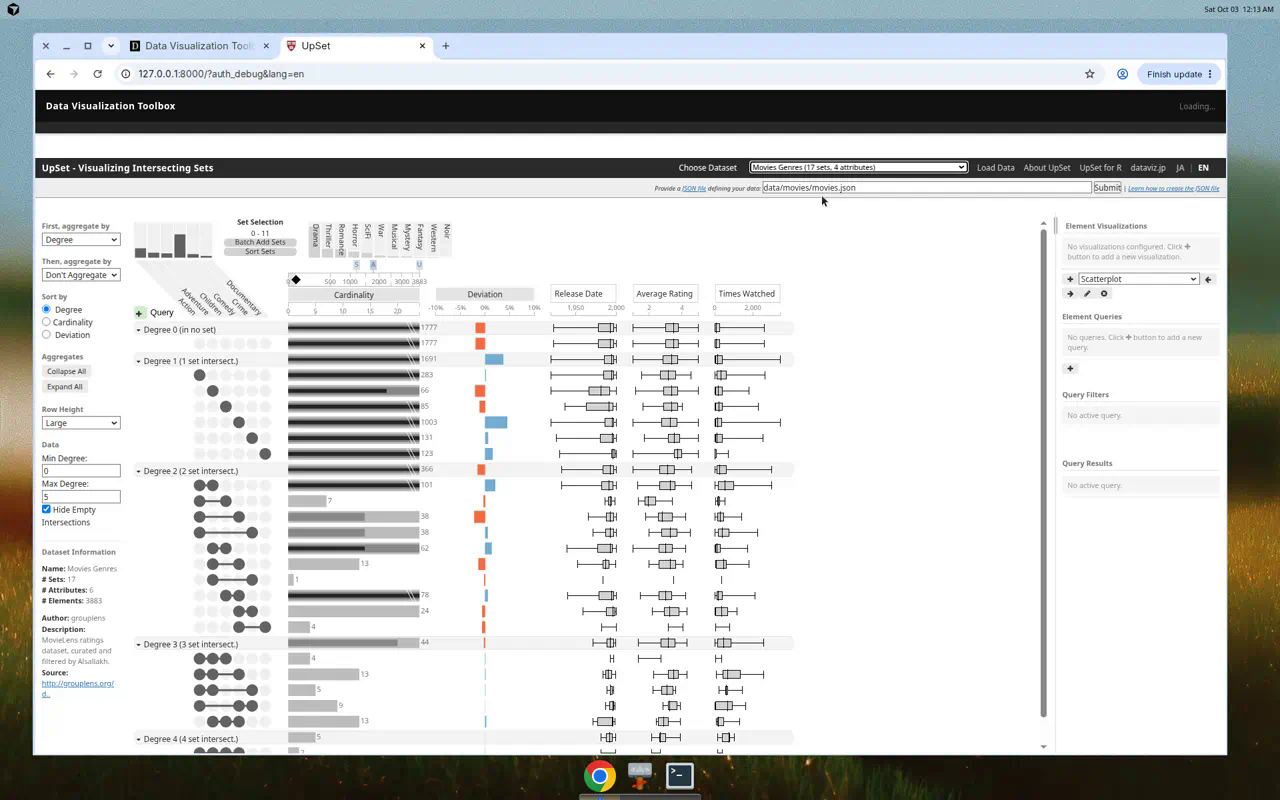
UpSet is an interactive visualization for exploring how multiple sets overlap. When a Venn diagram becomes hard to read, UpSet lines up intersections, cardinalities, and deviations as a matrix plus bar charts. You can aggregate and sort intersections, then query the items that belong to them.
Features
- Intersection matrix: Dots and lines show which sets combine; bars compare how many elements they contain
- Aggregation: Group by degree, set, deviation, or overlap degree, including a second aggregation level
- Sorting: Degree, cardinality, or deviation
- Set selection: Add or remove sets, and sort unused sets by size or name
- Element view: Inspect items in an intersection with scatterplots, histograms, word clouds, and a linked table
- Custom data: Load an UpSet JSON descriptor (table location plus set columns) from a URL
- Project saving: Save and restore the dataset pointer, active sets, aggregation, and sort order to the cloud
How to use
- Load a sample from the header, or pick a dataset from the list
- Choose which sets to use, then change aggregation and sorting in the left panel
- Click an intersection bar to drive the element queries and table on the right
- For your own data, open “Load Data” and paste the URL of a JSON descriptor
- Use “Save Project” in the header to keep the current view in the cloud
Data format
- File format: An UpSet JSON descriptor plus the tabular file it points to (CSV / TSV)
- The JSON defines
file,separator,header,sets(column range for set membership), andmeta(id and attribute columns) - Set columns are binary 0/1 membership flags
- A raw CSV file cannot be loaded on its own. See Data Import for the descriptor format