What is this tool?
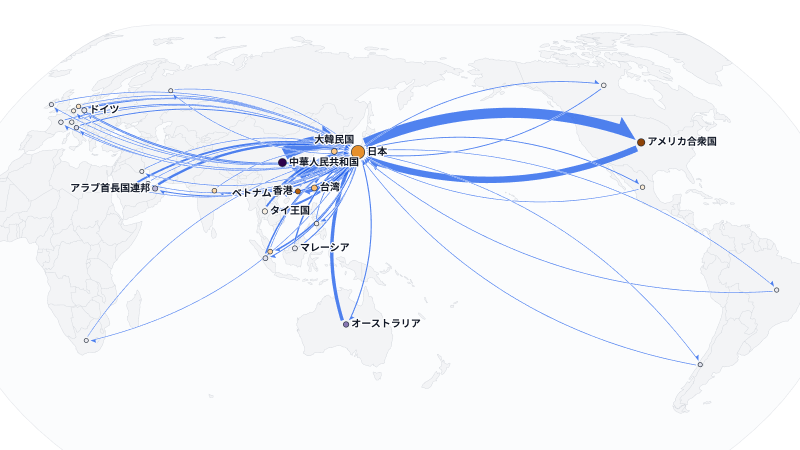
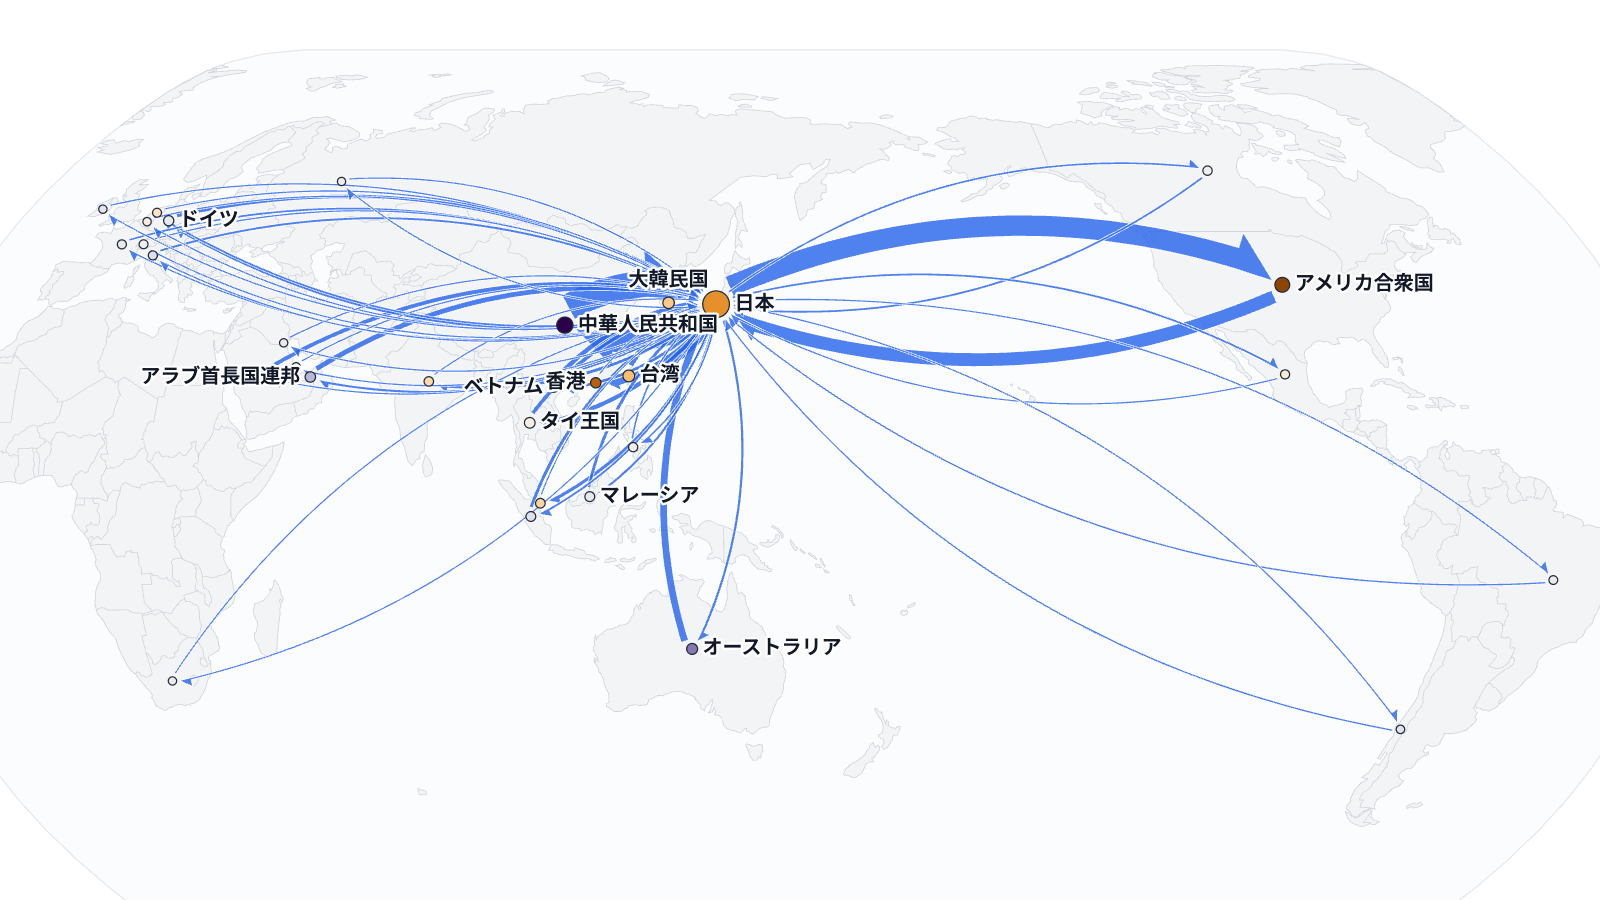
This tool draws “how much moved from where to where” as arrows on a map, such as migration between prefectures or trade between countries. Width shows the amount and the arrowhead shows the direction.
When A→B and B→A differ (for example, 26,284 people moved from Osaka to Tokyo and 20,207 from Tokyo to Osaka), the two arrows are drawn side by side, so you can read each amount and direction. You can also join a two-way pair into one ribbon whose ends show each direction.
World and Japan (prefecture) basemaps are built in. Prefecture, country and major city names are placed automatically; any other place can be given by latitude and longitude.
Features
- Input: edge lists (origin, destination, value) and origin-destination matrices, detected automatically
- Place matching: prefecture, country and major city names are placed from built-in gazetteers, or from latitude/longitude columns. Unmatched names are listed for review
- Basemap: world, Japan (prefectures) or none. Projection, center longitude (chosen from the data), extent, and an inset for the islands south of Kyushu
- Two-way pairs: two arrows side by side, or one ribbon whose ends show each direction
- Direction: even width with arrowhead, tapered, tapered with arrowhead, tapered with a center arrow
- Color: single, by value, by two-way imbalance, by origin, by destination. Places can be colored by net inflow
- Viewer controls: focus on a place (outflow / inflow / both), gross or net flows, switch years or other groups, zoom
- Export: SVG / PNG / CSV / JSON
- Share: publish a public page (
share.html?id=) and embed code from a saved project - Project save: save and restore data and settings in the cloud
How to use
- Upload a CSV / TSV / JSON file or load a sample
- In Mapping, check the origin, destination and value columns and the place matching result
- In Style, set the basemap, how two-way pairs are drawn, the direction shape, widths and colors
- In Annotate, add a title, source and unit
- Export an image, or save the project and share it publicly if needed
Data format
- File formats: CSV / TSV / JSON
- Edge list: one row per flow, with origin, destination and value columns (
from/to/valueand similar names). A year or group column lets viewers switch between groups - OD matrix: the first column is the origin; the other column headers are destinations; cells are the amounts
- Places not in the gazetteers can be given with latitude/longitude columns such as
from_lat/from_lon/to_lat/to_lon - Samples: migration between prefectures from Japan’s Report on Internal Migration (2025), and Japan’s exports and imports by country from the Trade Statistics of Japan (2021–2025)